The return of the water - IUCN
The return of the water - IUCN
The return of the water - IUCN

Create successful ePaper yourself
Turn your PDF publications into a flip-book with our unique Google optimized e-Paper software.
3<br />
Consequences <strong>of</strong> <strong>the</strong> Dam and <strong>the</strong><br />
Drought<br />
By Paul Loth<br />
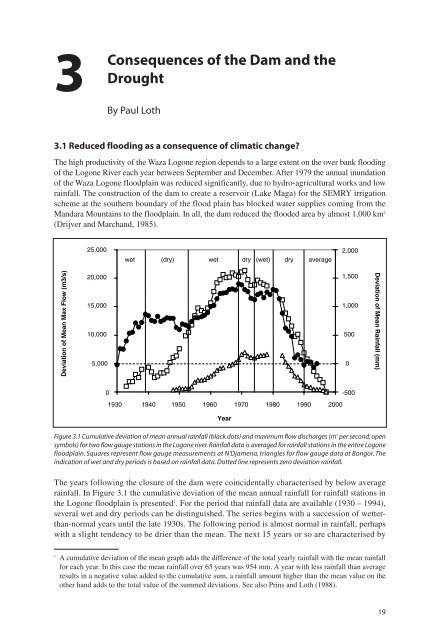
3.1 Reduced flooding as a consequence <strong>of</strong> climatic change?<br />
<strong>The</strong> high productivity <strong>of</strong> <strong>the</strong> Waza Logone region depends to a large extent on <strong>the</strong> over bank flooding<br />
<strong>of</strong> <strong>the</strong> Logone River each year between September and December. After 1979 <strong>the</strong> annual inundation<br />
<strong>of</strong> <strong>the</strong> Waza Logone floodplain was reduced significantly, due to hydro-agricultural works and low<br />
rainfall. <strong>The</strong> construction <strong>of</strong> <strong>the</strong> dam to create a reservoir (Lake Maga) for <strong>the</strong> SEMRY irrigation<br />
scheme at <strong>the</strong> sou<strong>the</strong>rn boundary <strong>of</strong> <strong>the</strong> flood plain has blocked <strong>water</strong> supplies coming from <strong>the</strong><br />
Mandara Mountains to <strong>the</strong> floodplain. In all, <strong>the</strong> dam reduced <strong>the</strong> flooded area by almost 1,000 km 2<br />
(Drijver and Marchand, 1985).<br />
Deviation <strong>of</strong> Mean Max Flow (m3/s)<br />
25,000<br />
20,000<br />
15,000<br />
10,000<br />
5,000<br />
0<br />
wet (dry) wet dry (wet) dry average<br />
1930 1940 1950 1960 1970 1980 1990 2000<br />
Year<br />
Figure 3.1 Cumulative deviation <strong>of</strong> mean annual rainfall (black dots) and maximum flow discharges (m 3 per second; open<br />
symbols) for two flow gauge stations in <strong>the</strong> Logone river. Rainfall data is averaged for rainfall stations in <strong>the</strong> entire Logone<br />
floodplain. Squares represent flow gauge measurements at N'Djamena, triangles for flow gauge data at Bongor. <strong>The</strong><br />
indication <strong>of</strong> wet and dry periods is based on rainfall data. Dotted line represents zero deviation rainfall.<br />
<strong>The</strong> years following <strong>the</strong> closure <strong>of</strong> <strong>the</strong> dam were coincidentally characterised by below average<br />
rainfall. In Figure 3.1 <strong>the</strong> cumulative deviation <strong>of</strong> <strong>the</strong> mean annual rainfall for rainfall stations in<br />
<strong>the</strong> Logone floodplain is presented 1 . For <strong>the</strong> period that rainfall data are available (1930 – 1994),<br />
several wet and dry periods can be distinguished. <strong>The</strong> series begins with a succession <strong>of</strong> wetterthan-normal<br />
years until <strong>the</strong> late 1930s. <strong>The</strong> following period is almost normal in rainfall, perhaps<br />
with a slight tendency to be drier than <strong>the</strong> mean. <strong>The</strong> next 15 years or so are characterised by<br />
1 A cumulative deviation <strong>of</strong> <strong>the</strong> mean graph adds <strong>the</strong> difference <strong>of</strong> <strong>the</strong> total yearly rainfall with <strong>the</strong> mean rainfall<br />
for each year. In this case <strong>the</strong> mean rainfall over 65 years was 954 mm. A year with less rainfall than average<br />
results in a negative value added to <strong>the</strong> cumulative sum, a rainfall amount higher than <strong>the</strong> mean value on <strong>the</strong><br />
o<strong>the</strong>r hand adds to <strong>the</strong> total value <strong>of</strong> <strong>the</strong> summed deviations. See also Prins and Loth (1988).<br />
2,000<br />
1,500<br />
1,000<br />
500<br />
0<br />
-500<br />
Deviation <strong>of</strong> Mean Rainfall (mm)<br />
19