The return of the water - IUCN
The return of the water - IUCN
The return of the water - IUCN
Create successful ePaper yourself
Turn your PDF publications into a flip-book with our unique Google optimized e-Paper software.
(Bauer, 1995) and 30-60 lions -with a mean <strong>of</strong> 50 - in <strong>the</strong> 1990s (De Iongh et al., 2002;Bauer, 2003).<br />
<strong>The</strong>se figures provide an indication <strong>of</strong> <strong>the</strong> order <strong>of</strong> magnitude <strong>of</strong> <strong>the</strong> absolute number <strong>of</strong> lions. <strong>The</strong>y<br />
cannot be used, however, to do a meaningful analysis <strong>of</strong> <strong>the</strong> trends in lion numbers.<br />
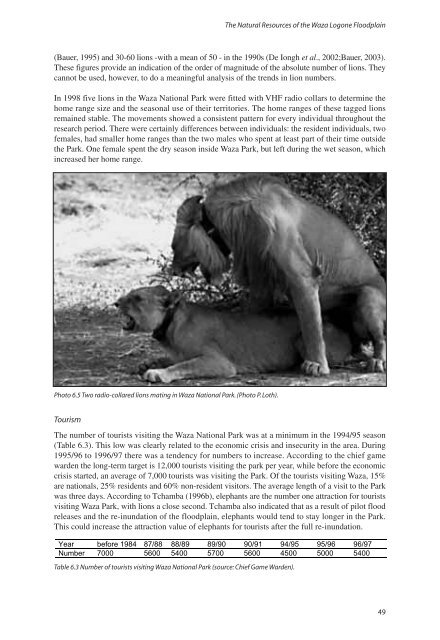
In 1998 five lions in <strong>the</strong> Waza National Park were fitted with VHF radio collars to determine <strong>the</strong><br />
home range size and <strong>the</strong> seasonal use <strong>of</strong> <strong>the</strong>ir territories. <strong>The</strong> home ranges <strong>of</strong> <strong>the</strong>se tagged lions<br />
remained stable. <strong>The</strong> movements showed a consistent pattern for every individual throughout <strong>the</strong><br />
research period. <strong>The</strong>re were certainly differences between individuals: <strong>the</strong> resident individuals, two<br />
females, had smaller home ranges than <strong>the</strong> two males who spent at least part <strong>of</strong> <strong>the</strong>ir time outside<br />
<strong>the</strong> Park. One female spent <strong>the</strong> dry season inside Waza Park, but left during <strong>the</strong> wet season, which<br />
increased her home range.<br />
Photo 6.5 Two radio-collared lions mating in Waza National Park. (Photo P. Loth).<br />
<strong>The</strong> Natural Resources <strong>of</strong> <strong>the</strong> Waza Logone Floodplain<br />
Tourism<br />
<strong>The</strong> number <strong>of</strong> tourists visiting <strong>the</strong> Waza National Park was at a minimum in <strong>the</strong> 1994/95 season<br />
(Table 6.3). This low was clearly related to <strong>the</strong> economic crisis and insecurity in <strong>the</strong> area. During<br />
1995/96 to 1996/97 <strong>the</strong>re was a tendency for numbers to increase. According to <strong>the</strong> chief game<br />
warden <strong>the</strong> long-term target is 12,000 tourists visiting <strong>the</strong> park per year, while before <strong>the</strong> economic<br />
crisis started, an average <strong>of</strong> 7,000 tourists was visiting <strong>the</strong> Park. Of <strong>the</strong> tourists visiting Waza, 15%<br />
are nationals, 25% residents and 60% non-resident visitors. <strong>The</strong> average length <strong>of</strong> a visit to <strong>the</strong> Park<br />
was three days. According to Tchamba (1996b), elephants are <strong>the</strong> number one attraction for tourists<br />
visiting Waza Park, with lions a close second. Tchamba also indicated that as a result <strong>of</strong> pilot flood<br />
releases and <strong>the</strong> re-inundation <strong>of</strong> <strong>the</strong> floodplain, elephants would tend to stay longer in <strong>the</strong> Park.<br />
This could increase <strong>the</strong> attraction value <strong>of</strong> elephants for tourists after <strong>the</strong> full re-inundation.<br />
Year before 1984 87/88 88/89 89/90 90/91 94/95 95/96 96/97<br />
Number 7000 5600 5400 5700 5600 4500 5000 5400<br />
Table 6.3 Number <strong>of</strong> tourists visiting Waza National Park (source: Chief Game Warden).<br />
49


