- Page 6 and 7:
L’editen: Conselleria de Salut i
- Page 9 and 10:
Presentació La nostra societat ha
- Page 11 and 12:
Però els individus i les seves con
- Page 13 and 14:
Dret a la salut Determinants de sal
- Page 15:
la salut, les accions preventives,
- Page 18 and 19:
16 Qui som Qui som 1. eStRuCtuRA De
- Page 20 and 21:
18 Qui som 2. Moviment natural de l
- Page 22 and 23:
20 Qui som Taula 2. Índex d’enve
- Page 24 and 25: 22 Com vivim: com a individus - - E
- Page 26 and 27: 24 Com vivim: com a individus - Est
- Page 28 and 29: 26 Com vivim: com a individus - Est
- Page 30 and 31: 28 Com vivim: com a individus - Est
- Page 32 and 33: 30 (%) Com vivim: com a individus -
- Page 34 and 35: 32 Com vivim: com a individus - Est
- Page 36 and 37: 34 (%) Com vivim: com a individus -
- Page 38 and 39: 36 Com vivim: com a individus - Est
- Page 40 and 41: 38 Com vivim: com a individus - Est
- Page 42 and 43: 40 Com vivim: com a individus - Est
- Page 44 and 45: 42 Com vivim: com a individus - Est
- Page 46 and 47: 44 Com vivim: com a individus - Est
- Page 48 and 49: 46 Com vivim: com a individus - Pr
- Page 50 and 51: 48 Com vivim: com a individus - Pr
- Page 52 and 53: 50 Com vivim: com a individus - Pr
- Page 54 and 55: 52 Com vivim: com a societat - Xarx
- Page 56 and 57: 54 (%) en el treball Com vivim: com
- Page 58 and 59: 56 Com vivim: com a societat - Cond
- Page 60 and 61: 58 Com vivim: com a societat - Cond
- Page 62 and 63: 60 Com vivim: com a societat - Cond
- Page 64 and 65: 62 Com vivim: com a societat - Cond
- Page 66 and 67: 64 Com vivim: com a societat - Cond
- Page 68 and 69: 66 Com vivim: com a societat - Cond
- Page 70 and 71: 68 Com vivim: com a societat - Cond
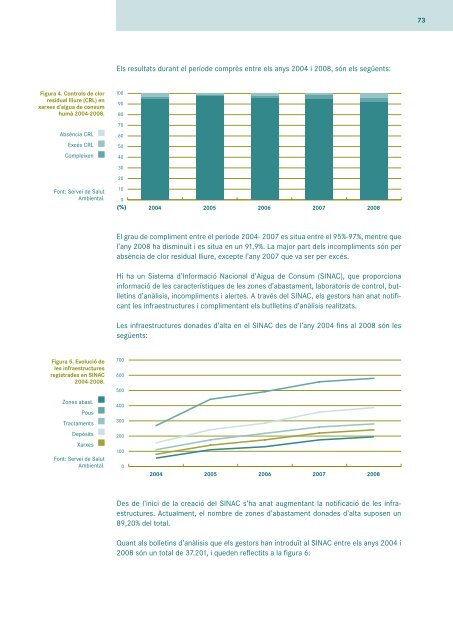
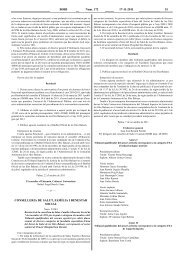
- Page 72 and 73: 70 Com vivim: com a societat - Cond
- Page 76 and 77: 74 5000 4500 4000 3500 3000 2500 20
- Page 78 and 79: 76 Com vivim: com a societat - Cond
- Page 80 and 81: 78 Com vivim: com a societat - Cond
- Page 82 and 83: 80 Com vivim: com a societat - Cond
- Page 84 and 85: 82 Com vivim: com a societat - Cond
- Page 86 and 87: 84 Com vivim: com a societat - Cond
- Page 88 and 89: 86 Com vivim: com a societat - Cond
- Page 90 and 91: 88 Com vivim: com a societat - Cond
- Page 92 and 93: 90 Com vivim: com a societat - Cond
- Page 94 and 95: 92 Com vivim: com a societat - Cond
- Page 96 and 97: 94 Font: Servei de Seguretat Alimen
- Page 98 and 99: 96 Com vivim: com a societat - Cond
- Page 100 and 101: 98 Com vivim: com a societat - Cond
- Page 102 and 103: 100 Com vivim: com a societat - Con
- Page 104 and 105: 102 Com vivim: com a societat - Con
- Page 106 and 107: 104 Com vivim: com a societat - Con
- Page 108 and 109: 106 Com vivim: com a societat - Con
- Page 110 and 111: 108 Com vivim: com a societat - Con
- Page 112 and 113: 110 Com vivim: com a societat - Con
- Page 114 and 115: 112 Com vivim: com a societat - Con
- Page 116 and 117: 114 1.3. Gestió Com vivim: com a s
- Page 118 and 119: 116 Com vivim: com a societat - Con
- Page 120 and 121: 118 Com vivim: com a societat - Con
- Page 122 and 123: 120 Com vivim: com a societat - Con
- Page 124 and 125:
122 Com vivim: com a societat - Con
- Page 126 and 127:
124 Com vivim: com a societat - Con
- Page 128 and 129:
126 Com vivim: com a societat - Con
- Page 130 and 131:
128 Com vivim: com a societat - Con
- Page 132 and 133:
130 Com vivim: com a societat - Con
- Page 134 and 135:
132 Com vivim: com a societat - Con
- Page 136 and 137:
134 Com vivim: com a societat - Con
- Page 138 and 139:
136 Com vivim: com a societat - Con
- Page 140 and 141:
138 Com vivim: com a societat - Con
- Page 142 and 143:
140 Com vivim: com a societat - Con
- Page 144 and 145:
142 Com vivim: com a societat - Con
- Page 146 and 147:
144 5.3. Serveis Com vivim: com a s
- Page 148 and 149:
146 Com vivim: com a societat - Con
- Page 150 and 151:
148 Com vivim: com a societat - Con
- Page 152 and 153:
150 Com vivim: com a societat - Con
- Page 154 and 155:
152 Com vivim: com a societat - Con
- Page 156 and 157:
154 Com vivim: com a societat - Con
- Page 158 and 159:
156 Com vivim: com a societat - Con
- Page 160 and 161:
158 Com vivim: com a societat - Con
- Page 162 and 163:
160 Com vivim: com a societat - Con
- Page 164 and 165:
162 Com vivim: com a societat - Con
- Page 166 and 167:
164 Com vivim: com a societat - Con
- Page 168 and 169:
166 Com vivim: com a societat - Con
- Page 170 and 171:
168 Com vivim: com a societat - Con
- Page 172 and 173:
170 Com vivim: com a societat - Con
- Page 174 and 175:
172 Com vivim: com a societat - Con
- Page 176 and 177:
174 Com vivim: com a societat - Con
- Page 178 and 179:
176 Com vivim: com a societat - Con
- Page 180 and 181:
178 Com vivim: com a societat - Con
- Page 182 and 183:
180 Com vivim: com a societat - Con
- Page 184 and 185:
182 Com vivim: com a societat - Con
- Page 186:
184 Com vivim: com a societat - Con
- Page 190 and 191:
188 De què emmalaltim De què emma
- Page 192 and 193:
190 De què emmalaltim: estat de sa
- Page 194 and 195:
192 De què emmalaltim: estat de sa
- Page 196 and 197:
194 De què emmalaltim: estat de sa
- Page 198 and 199:
196 De què emmalaltim: estat de sa
- Page 200 and 201:
198 De què emmalaltim: malalties t
- Page 202 and 203:
200 De què emmalaltim: malalties t
- Page 204 and 205:
202 De què emmalaltim: malalties t
- Page 206 and 207:
204 De què emmalaltim: malalties t
- Page 208 and 209:
206 De què emmalaltim: malalties t
- Page 210 and 211:
208 De què emmalaltim: malalties t
- Page 212 and 213:
210 De què emmalaltim: malalties t
- Page 214 and 215:
212 De què emmalaltim: malalties c
- Page 216 and 217:
214 De què emmalaltim: malalties c
- Page 218 and 219:
216 De què emmalaltim: malalties c
- Page 220 and 221:
218 De què emmalaltim: malalties c
- Page 222 and 223:
220 De què emmalaltim: malalties c
- Page 224 and 225:
222 De què emmalaltim: malalties c
- Page 226 and 227:
224 De què emmalaltim: malalties o
- Page 228 and 229:
226 De què emmalaltim: malalties o
- Page 230 and 231:
228 De què emmalaltim: malalties o
- Page 232 and 233:
230 De què emmalaltim: malalties o
- Page 234 and 235:
232 De què emmalaltim: malalties o
- Page 236 and 237:
234 De què emmalaltim: malalties o
- Page 238 and 239:
236 De què emmalaltim: Diabetis me
- Page 240 and 241:
238 De què emmalaltim: Diabetis me
- Page 242 and 243:
240 De què emmalaltim: Diabetis me
- Page 244 and 245:
242 De què emmalaltim: Diabetis me
- Page 246 and 247:
244 De què emmalaltim: malalties r
- Page 248 and 249:
246 De què emmalaltim: malalties r
- Page 250 and 251:
248 De què emmalaltim: malalties r
- Page 252 and 253:
250 De què emmalaltim: malalties r
- Page 254 and 255:
252 De què emmalaltim: malalties m
- Page 256 and 257:
254 De què emmalaltim: malalties m
- Page 258 and 259:
256 De què emmalaltim: malalties m
- Page 260 and 261:
258 De què emmalaltim: Lesions Qua
- Page 262 and 263:
260 De què emmalaltim: Lesions Les
- Page 264 and 265:
262 De què emmalaltim: Lesions Min
- Page 266 and 267:
264 De què emmalaltim: Lesions 3.6
- Page 268 and 269:
266 De què emmalaltim: Lesions Ún
- Page 270 and 271:
268 De què morim Per grups d’eda
- Page 272 and 273:
270 De què morim Les malalties del
- Page 274 and 275:
272 De què morim Si comparam les d
- Page 276 and 277:
274 De què morim Taula 3. Cinc cau
- Page 278 and 279:
276 De què morim Les taxes ajustad
- Page 280 and 281:
278 De què morim II. tumors III. S
- Page 282 and 283:
ute FinanÇaMent pressupo gestió c
- Page 284 and 285:
282 Despesa sanitària Finançament
- Page 286 and 287:
284 Despesa sanitària Una altra da
- Page 288 and 289:
286 Despesa sanitària Els incremen
- Page 290 and 291:
288 Conclusions qualitat de Vida po
- Page 292 and 293:
290 Conclusions Conclusions El diag
- Page 294 and 295:
292 Conclusions Entre els problemes
- Page 296 and 297:
294 Annexos ForMació decrets inVes
- Page 298 and 299:
296 Annexos Formació, investigaci
- Page 300 and 301:
298 Annexos Els trasplantaments i l
- Page 302 and 303:
300 Annexos Informació jurídica:
- Page 304 and 305:
302 Annexos 11. Decret 75/2008, de
- Page 306 and 307:
304 Annexos seus productes a l’à
- Page 308 and 309:
306 Annexos 66. Decret 8/2002, d’
- Page 310 and 311:
308 Annexos 21. Ordre de la consell
- Page 312 and 313:
310 Annexos eStILS De VIDA Hàbits
- Page 314 and 315:
312 Annexos Com vivim: com a societ
- Page 316 and 317:
314 Annexos SeRVeIS SANItARIS ILLeS
- Page 318 and 319:
316 Annexos DIABetIS meLLItuS evolu
- Page 320:
318 Annexos moRtALItAt mortalitat p