Nom. Estación (Mendoza) Fecha PRESIÓN ATMOSFÉRICA CIM Tu Tiempo DIFF (mb) 90 Nom. Estación (La P<strong>la</strong>ta) Fecha CIM PRESIÓN ATMOSFÉRICA Tu Tiempo 87418 01/01/06 929,1 929,3 0,2 87593 01/01/06 1008,1 1008,3 0,2 87418 02/01/06 933,4 931,7 -1,7 87593 02/01/06 1008,5 1008,2 -0,3 87418 03/01/06 932,5 933,4 0,9 87593 03/01/06 1010,8 1010,2 -0,6 87418 04/01/06 927,5 928,1 0,6 87593 04/01/06 1009,5 1009,8 0,3 87418 05/01/06 926,2 926,3 0,1 87593 05/01/06 1007,1 1007,7 0,6 87418 06/01/06 927,5 927,6 0,1 87593 06/01/06 1005,3 1005,2 -0,1 87418 07/01/06 924,2 924,6 0,4 87593 07/01/06 1006,7 1006,3 -0,4 87418 08/01/06 927,1 926,5 -0,6 87593 08/01/06 1004,4 1005 0,6 87418 09/01/06 920 923,5 3,5 87593 09/01/06 1003 1007,1 4,1 87418 10/01/06 933,2 928,6 -4,6 87593 10/01/06 1008,1 1003,4 -4,7 87418 11/01/06 927,9 929,2 1,3 87593 11/01/06 1012,9 1013,6 0,7 87418 12/01/06 932,8 929,7 -3,1 87593 12/01/06 1008,7 1008,6 -0,1 87418 13/01/06 931,5 932,8 1,3 87593 13/01/06 1015,3 1014,8 -0,5 87418 14/01/06 925,7 926,6 0,9 87593 14/01/06 1010 1011,8 1,8 87418 15/01/06 927,4 926,5 -0,9 87593 15/01/06 1004,4 1004,7 0,3 87418 16/01/06 939,6 937,7 -1,9 87593 16/01/06 1013,9 1009,4 -4,5 87418 17/01/06 937,2 937,8 0,6 87593 17/01/06 1021 1020,7 -0,3 87418 18/01/06 930 932,1 2,1 87593 18/01/06 1017,4 1019,2 1,8 87418 19/01/06 925,5 925,8 0,3 87593 19/01/06 1009,1 1010,2 1,1 87418 20/01/06 931,1 929,5 -1,6 87593 20/01/06 1007,3 1007,2 -0,1 87418 21/01/06 934,6 934,2 -0,4 87593 21/01/06 1011,7 1010,8 -0,9 87418 22/01/06 931,8 931,6 -0,2 87593 22/01/06 1013,5 1013,7 0,2 87418 23/01/06 928,6 928,9 0,3 87593 23/01/06 1010 1010,8 0,8 87418 24/01/06 928,7 928,5 -0,2 87593 24/01/06 1006,1 1006,4 0,3 87418 25/01/06 934,4 933,6 -0,8 87593 25/01/06 1008,7 1007,2 -1,5 87418 26/01/06 930,5 931,2 0,7 87593 26/01/06 1014,3 1014,5 0,2 87418 27/01/06 929,5 929,5 0 87593 27/01/06 1011 1011,6 0,6 87418 28/01/06 929,7 929,9 0,2 87593 28/01/06 1009,4 1009,7 0,3 87418 29/01/06 928,4 928,1 -0,3 87593 29/01/06 1005,6 1005,3 -0,3 DIFF. Tab<strong>la</strong> 9: comparación <strong>de</strong> datos <strong>de</strong>l servicio meteorológico Nacional Argentina y Datos publicados en <strong>la</strong> página web www.tutiempo.net Se llegó a <strong>la</strong> conclusión que <strong>la</strong>s estaciones meteorológicas publicadas es este sitio correspon<strong>de</strong>n y son <strong>de</strong>nominadas con <strong>la</strong> misma nomenc<strong>la</strong>tura que <strong>la</strong>s provenientes <strong>de</strong>l servicio meteorológico nacional Argentino. Al igual que <strong>la</strong>s nomenc<strong>la</strong>turas se encontró que los datos son muy simi<strong>la</strong>res en ambos sitios, presentando una diferencia mínima entre ellos. La tab<strong>la</strong> nº 9 muestra a modo <strong>de</strong> ejemplo un periodo <strong>de</strong> comparación para <strong>la</strong>s ciuda<strong>de</strong>s <strong>de</strong> Mendoza y La P<strong>la</strong>ta. (mb)
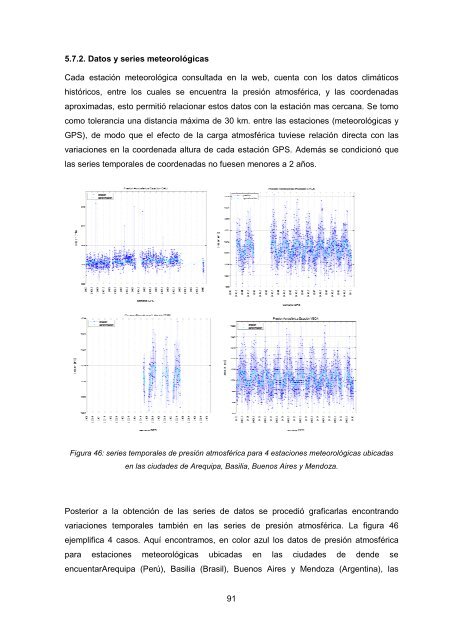
5.7.2. Datos y series meteorológicas Cada estación meteorológica consultada en <strong>la</strong> web, cuenta con los datos climáticos históricos, entre los cuales se encuentra <strong>la</strong> presión atmosférica, y <strong>la</strong>s coor<strong>de</strong>nadas aproximadas, esto permitió re<strong>la</strong>cionar estos datos con <strong>la</strong> estación mas cercana. Se tomo como tolerancia una distancia máxima <strong>de</strong> 30 km. entre <strong>la</strong>s estaciones (meteorológicas y GPS), <strong>de</strong> modo que el efecto <strong>de</strong> <strong>la</strong> carga atmosférica tuviese re<strong>la</strong>ción directa con <strong>la</strong>s variaciones en <strong>la</strong> coor<strong>de</strong>nada altura <strong>de</strong> cada estación GPS. A<strong>de</strong>más se condicionó que <strong>la</strong>s series temporales <strong>de</strong> coor<strong>de</strong>nadas no fuesen menores a 2 años. Figura 46: series temporales <strong>de</strong> presión atmosférica para 4 estaciones meteorológicas ubicadas en <strong>la</strong>s ciuda<strong>de</strong>s <strong>de</strong> Arequipa, Basilia, Buenos Aires y Mendoza. Posterior a <strong>la</strong> obtención <strong>de</strong> <strong>la</strong>s series <strong>de</strong> datos se procedió graficar<strong>la</strong>s encontrando variaciones temporales también en <strong>la</strong>s series <strong>de</strong> presión atmosférica. La figura 46 ejemplifica 4 casos. Aquí encontramos, en color azul los datos <strong>de</strong> presión atmosférica para estaciones meteorológicas ubicadas en <strong>la</strong>s ciuda<strong>de</strong>s <strong>de</strong> <strong>de</strong>n<strong>de</strong> se encuentarArequipa (Perú), Basilia (Brasil), Buenos Aires y Mendoza (Argentina), <strong>la</strong>s 91
- Page 1 and 2:
Universidad Nacional de Cuyo Tesis
- Page 3 and 4:
Prólogo La presente tesis se desar
- Page 5 and 6:
Resumen El sistema de referencia es
- Page 7 and 8:
monument, maintain and operate. Plu
- Page 9 and 10:
Siglas utilizadas en el texto BSW B
- Page 11 and 12:
Tabla de contenidos CAPITULO I: Nec
- Page 13 and 14:
4.2.4.2. Análisis de la deformaci
- Page 15 and 16:
Lista de Figuras Figura 1: medició
- Page 17 and 18:
Figura 42: Variación de coordenada
- Page 19 and 20:
1.1. Introducción 1 CAPITULO I Nec
- Page 21 and 22:
1.2. Demandas del sistema de refere
- Page 23 and 24:
• Jason 2: http://topex-www.jpl.n
- Page 25 and 26:
con la atracción gravitatoria terr
- Page 27 and 28:
en sus coordenadas se traducen en e
- Page 29 and 30:
espectivas variaciones es posible m
- Page 31 and 32:
Figura 10: Desplazamientos horizont
- Page 33 and 34:
Marco de Referencia Época IGS05 20
- Page 35 and 36:
ejemplo se aplica al área de defor
- Page 37 and 38:
la atmósfera, no existiría dificu
- Page 39 and 40:
Es decir un sistema de referencia p
- Page 41 and 42:
La última realización del ITRF re
- Page 43 and 44:
Se calcularon 14 parámetros de tra
- Page 45 and 46:
de DORIS durante 1993 y el GPS sobr
- Page 47 and 48:
EL marco ITRF2008 antes descripto i
- Page 49 and 50:
Dado que los países latinoamerican
- Page 51 and 52:
Los siete Centros de Procesamiento
- Page 53 and 54:
Figura 19: Red SIRGAS SIRGAS-CON. S
- Page 55 and 56:
2.6. Conclusiones del capítulo En
- Page 57 and 58: detalle en los siguiente capítulos
- Page 59 and 60: Center) (http://sopac.ucsd.edu/data
- Page 61 and 62: Los EOP (Earth Orientation Paramete
- Page 63 and 64: SATELLIT.I05: contiene la informaci
- Page 65 and 66: Para considerar la influencia sobre
- Page 67 and 68: El nuevo modelo Precesión-nutació
- Page 69 and 70: Figura 23_a: configuración de la r
- Page 71 and 72: En esta etapa los parámetros son e
- Page 73 and 74: Además de la estrategia de ajuste
- Page 75 and 76: Considerando todos estos elementos
- Page 77 and 78: El programa Bernese 5.0, propone pa
- Page 79 and 80: siendo la época de referencia de c
- Page 81 and 82: Cabe mencionar que los parámetros
- Page 83 and 84: Figura 26_a: residuos luego de apli
- Page 85 and 86: oto-traslada tratándola de acomoda
- Page 87 and 88: Es posible observar como la estrate
- Page 89 and 90: 4.2.4.3. Análisis de la deformaci
- Page 91 and 92: Central. Cabe recordar que esta sol
- Page 93 and 94: han observado deformaciones del ord
- Page 95 and 96: Por otro lado los marcos activos en
- Page 97 and 98: Figura 36: globales de deformación
- Page 99 and 100: elevamiento. A continuación se mue
- Page 101 and 102: vinculándola a la solución semana
- Page 103 and 104: El mismo análisis se puede realiza
- Page 105 and 106: Esta variabilidad se marca principa
- Page 107: 5.7.1. Recopilación de antecedente
- Page 111 and 112: Figura 47: Series temporales de la
- Page 113 and 114: 5.8. Conclusiones y trabajos futuro
- Page 115 and 116: llevarlo a la práctica o hacer uso
- Page 117 and 118: Seleccionadas las observaciones que
- Page 119 and 120: afectada por variaciones temporales
- Page 121 and 122: problema (por ejemplo, con celdas d
- Page 123 and 124: Drewes H. (2008). El Sistema de Obs
- Page 125 and 126: Sánchez, L., W. Seemüller, M. Sei
- Page 127 and 128: 109 + + + + + + + + + + + + + + + +
- Page 129 and 130: 111
- Page 131 and 132: 113
- Page 133 and 134: Promedio de los residuos luego de a
- Page 135 and 136: 117
- Page 137 and 138: 119
- Page 139 and 140: 121
- Page 141 and 142: 123
- Page 143 and 144: 125
- Page 145 and 146: 127
- Page 147 and 148: 129
- Page 149 and 150: 131
- Page 151 and 152: 133
- Page 153 and 154: 135
- Page 155 and 156: 137
- Page 157 and 158: 139
- Page 159 and 160:
141
- Page 161 and 162:
143
- Page 163 and 164:
145
- Page 165 and 166:
147
- Page 167 and 168:
149
- Page 169 and 170:
Promedio de los residuos luego de a
- Page 171 and 172:
RIOP 3,153 7,282 3,41 4,653 2,687 5
- Page 173 and 174:
155
- Page 175 and 176:
ANEXO IV: Series de coordenadas de
- Page 177 and 178:
159
- Page 179 and 180:
161
- Page 181 and 182:
163
- Page 183 and 184:
165
- Page 185 and 186:
167
- Page 187 and 188:
169
- Page 189 and 190:
171
- Page 191 and 192:
173
- Page 193 and 194:
175
- Page 195 and 196:
177
- Page 197 and 198:
179
- Page 199 and 200:
181
- Page 201 and 202:
183
- Page 203 and 204:
185
- Page 205 and 206:
187
- Page 207 and 208:
189
- Page 209 and 210:
191
- Page 211 and 212:
193
- Page 213 and 214:
195
- Page 215 and 216:
197
- Page 217 and 218:
199
- Page 219 and 220:
201
- Page 221 and 222:
203
- Page 223 and 224:
205
- Page 225 and 226:
207
- Page 227 and 228:
209
- Page 229 and 230:
211
- Page 231 and 232:
213
- Page 233 and 234:
215
- Page 235 and 236:
217
- Page 237 and 238:
219
- Page 239 and 240:
221
- Page 241 and 242:
223
- Page 243 and 244:
225
- Page 245 and 246:
227
- Page 247 and 248:
229
- Page 249 and 250:
231
- Page 251 and 252:
233
- Page 253 and 254:
235
- Page 255 and 256:
237
- Page 257 and 258:
239
- Page 259 and 260:
241
- Page 261 and 262:
243
- Page 263 and 264:
245
- Page 265 and 266:
247
- Page 267 and 268:
249
- Page 269:
251