Descargar PDF - ETSI de Minas de la UPM
Descargar PDF - ETSI de Minas de la UPM
Descargar PDF - ETSI de Minas de la UPM

Create successful ePaper yourself
Turn your PDF publications into a flip-book with our unique Google optimized e-Paper software.
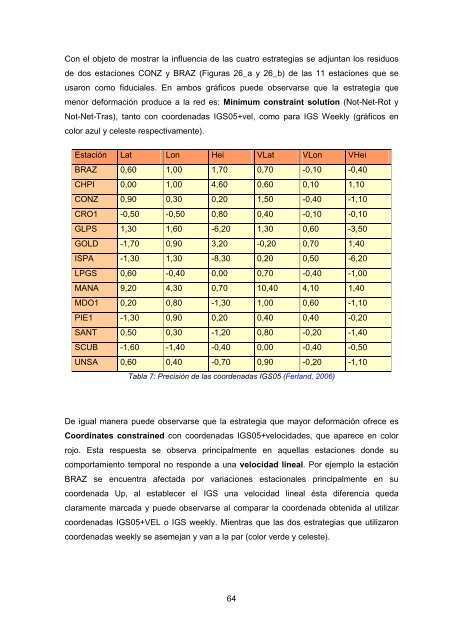
Con el objeto <strong>de</strong> mostrar <strong>la</strong> influencia <strong>de</strong> <strong>la</strong>s cuatro estrategias se adjuntan los residuos<br />
<strong>de</strong> dos estaciones CONZ y BRAZ (Figuras 26_a y 26_b) <strong>de</strong> <strong>la</strong>s 11 estaciones que se<br />
usaron como fiduciales. En ambos gráficos pue<strong>de</strong> observarse que <strong>la</strong> estrategia que<br />
menor <strong>de</strong>formación produce a <strong>la</strong> red es: Minimum constraint solution (Not-Net-Rot y<br />
Not-Net-Tras), tanto con coor<strong>de</strong>nadas IGS05+vel, como para IGS Weekly (gráficos en<br />
color azul y celeste respectivamente).<br />
Estación Lat Lon Hei VLat VLon VHei<br />
BRAZ 0,60 1,00 1,70 0,70 -0,10 -0,40<br />
CHPI 0,00 1,00 4,60 0,60 0,10 1,10<br />
CONZ 0,90 0,30 0,20 1,50 -0,40 -1,10<br />
CRO1 -0,50 -0,50 0,80 0,40 -0,10 -0,10<br />
GLPS 1,30 1,60 -6,20 1,30 0,60 -3,50<br />
GOLD -1,70 0,90 3,20 -0,20 0,70 1,40<br />
ISPA -1,30 1,30 -8,30 0,20 0,50 -6,20<br />
LPGS 0,60 -0,40 0,00 0,70 -0,40 -1,00<br />
MANA 9,20 4,30 0,70 10,40 4,10 1,40<br />
MDO1 0,20 0,80 -1,30 1,00 0,60 -1,10<br />
PIE1 -1,30 0,90 0,20 0,40 0,40 -0,20<br />
SANT 0,50 0,30 -1,20 0,80 -0,20 -1,40<br />
SCUB -1,60 -1,40 -0,40 0,00 -0,40 -0,50<br />
UNSA 0,60 0,40 -0,70 0,90 -0,20 -1,10<br />
Tab<strong>la</strong> 7: Precisión <strong>de</strong> <strong>la</strong>s coor<strong>de</strong>nadas IGS05 (Fer<strong>la</strong>nd, 2006)<br />
De igual manera pue<strong>de</strong> observarse que <strong>la</strong> estrategia que mayor <strong>de</strong>formación ofrece es<br />
Coordinates constrained con coor<strong>de</strong>nadas IGS05+velocida<strong>de</strong>s, que aparece en color<br />
rojo. Esta respuesta se observa principalmente en aquel<strong>la</strong>s estaciones don<strong>de</strong> su<br />
comportamiento temporal no respon<strong>de</strong> a una velocidad lineal. Por ejemplo <strong>la</strong> estación<br />
BRAZ se encuentra afectada por variaciones estacionales principalmente en su<br />
coor<strong>de</strong>nada Up, al establecer el IGS una velocidad lineal ésta diferencia queda<br />
c<strong>la</strong>ramente marcada y pue<strong>de</strong> observarse al comparar <strong>la</strong> coor<strong>de</strong>nada obtenida al utilizar<br />
coor<strong>de</strong>nadas IGS05+VEL o IGS weekly. Mientras que <strong>la</strong>s dos estrategias que utilizaron<br />
coor<strong>de</strong>nadas weekly se asemejan y van a <strong>la</strong> par (color ver<strong>de</strong> y celeste).<br />
64