Descargar PDF - ETSI de Minas de la UPM
Descargar PDF - ETSI de Minas de la UPM
Descargar PDF - ETSI de Minas de la UPM

Create successful ePaper yourself
Turn your PDF publications into a flip-book with our unique Google optimized e-Paper software.
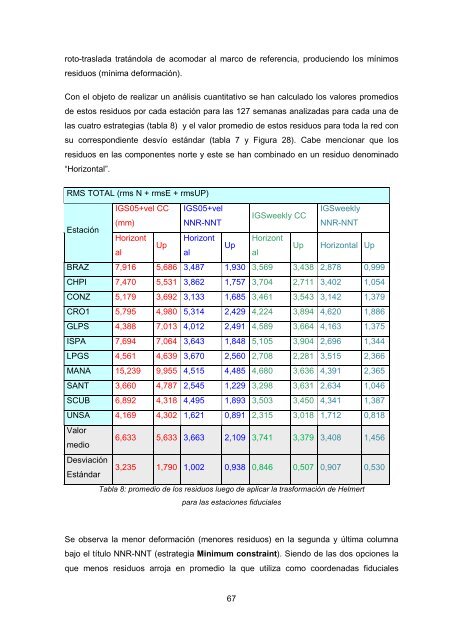
oto-tras<strong>la</strong>da tratándo<strong>la</strong> <strong>de</strong> acomodar al marco <strong>de</strong> referencia, produciendo los mínimos<br />
residuos (mínima <strong>de</strong>formación).<br />
Con el objeto <strong>de</strong> realizar un análisis cuantitativo se han calcu<strong>la</strong>do los valores promedios<br />
<strong>de</strong> estos residuos por cada estación para <strong>la</strong>s 127 semanas analizadas para cada una <strong>de</strong><br />
<strong>la</strong>s cuatro estrategias (tab<strong>la</strong> 8) y el valor promedio <strong>de</strong> estos residuos para toda <strong>la</strong> red con<br />
su correspondiente <strong>de</strong>svío estándar (tab<strong>la</strong> 7 y Figura 28). Cabe mencionar que los<br />
residuos en <strong>la</strong>s componentes norte y este se han combinado en un residuo <strong>de</strong>nominado<br />
“Horizontal”.<br />
RMS TOTAL (rms N + rmsE + rmsUP)<br />
Estación<br />
IGS05+vel CC<br />
(mm)<br />
Horizont<br />
al<br />
Up<br />
IGS05+vel<br />
NNR-NNT<br />
Horizont<br />
al<br />
Up<br />
67<br />
IGSweekly CC<br />
Horizont<br />
al<br />
IGSweekly<br />
NNR-NNT<br />
Up Horizontal Up<br />
BRAZ 7,916 5,686 3,487 1,930 3,569 3,438 2,878 0,999<br />
CHPI 7,470 5,531 3,862 1,757 3,704 2,711 3,402 1,054<br />
CONZ 5,179 3,692 3,133 1,685 3,461 3,543 3,142 1,379<br />
CRO1 5,795 4,980 5,314 2,429 4,224 3,894 4,620 1,886<br />
GLPS 4,388 7,013 4,012 2,491 4,589 3,664 4,163 1,375<br />
ISPA 7,694 7,064 3,643 1,848 5,105 3,904 2,696 1,344<br />
LPGS 4,561 4,639 3,670 2,560 2,708 2,281 3,515 2,366<br />
MANA 15,239 9,955 4,515 4,485 4,680 3,636 4,391 2,365<br />
SANT 3,660 4,787 2,545 1,229 3,298 3,631 2,634 1,046<br />
SCUB 6,892 4,318 4,495 1,893 3,503 3,450 4,341 1,387<br />
UNSA 4,169 4,302 1,621 0,891 2,315 3,018 1,712 0,818<br />
Valor<br />
medio<br />
Desviación<br />
Estándar<br />
6,633 5,633 3,663 2,109 3,741 3,379 3,408 1,456<br />
3,235 1,790 1,002 0,938 0,846 0,507 0,907 0,530<br />
Tab<strong>la</strong> 8: promedio <strong>de</strong> los residuos luego <strong>de</strong> aplicar <strong>la</strong> trasformación <strong>de</strong> Helmert<br />
para <strong>la</strong>s estaciones fiduciales<br />
Se observa <strong>la</strong> menor <strong>de</strong>formación (menores residuos) en <strong>la</strong> segunda y última columna<br />
bajo el título NNR-NNT (estrategia Minimum constraint). Siendo <strong>de</strong> <strong>la</strong>s dos opciones <strong>la</strong><br />
que menos residuos arroja en promedio <strong>la</strong> que utiliza como coor<strong>de</strong>nadas fiduciales