Memoria 2005. Dirección General de PolÃtica de la PYME
Memoria 2005. Dirección General de PolÃtica de la PYME
Memoria 2005. Dirección General de PolÃtica de la PYME

You also want an ePaper? Increase the reach of your titles
YUMPU automatically turns print PDFs into web optimized ePapers that Google loves.
ÁREAS FUNCIONALES:ACTIVIDADES<br />
29<br />
<strong>de</strong> situación y para <strong>la</strong> incorporación <strong>de</strong> procesos<br />
<strong>de</strong> innovación e imp<strong>la</strong>ntación <strong>de</strong> mecanismos<br />
innovadores en <strong>la</strong> gestión y organización.<br />
Los beneficiarios <strong>de</strong> <strong>la</strong>s ayudas son <strong>la</strong>s pequeñas<br />
y medianas empresas, bien directamente, bien a<br />
través <strong>de</strong> los Organismos intermedios, tales<br />
como centros tecnológicos y <strong>de</strong> servicios, asociaciones<br />
empresariales, centros <strong>de</strong> empresa e<br />
innovación, etc.<br />
El PCCP, ha sido promovido y está coordinado<br />
por <strong>la</strong> Dirección <strong>General</strong> <strong>de</strong> Política <strong>de</strong> <strong>la</strong> <strong>PYME</strong><br />
y su gestión está encomendada a <strong>la</strong>s comunida<strong>de</strong>s<br />
autónomas. Su ejecución en <strong>la</strong>s regiones<br />
objetivo 1 se incardina parcialmente en el<br />
“Programa Operativo <strong>de</strong> Mejora <strong>de</strong> <strong>la</strong><br />
Competitividad y Desarrollo <strong>de</strong>l Tejido<br />
Productivo 2000-2006”.<br />
El PCCP está cofinanciado por <strong>la</strong> Administración<br />
<strong>General</strong> <strong>de</strong>l Estado (63%), el Fondo Europeo <strong>de</strong><br />
Desarrollo Regional (22%) y <strong>la</strong>s comunida<strong>de</strong>s<br />
autónomas (15%). El presupuesto total para el<br />
año 2005 ha sido <strong>de</strong> 73.209.268,30 .<br />
La financiación acumu<strong>la</strong>da <strong>de</strong>l PCCP para el<br />
periodo 2000-2005 ha sido <strong>de</strong> 428.778.114,40 .<br />
El 74% ha sido <strong>de</strong>stinado a regiones objetivo 1 y<br />
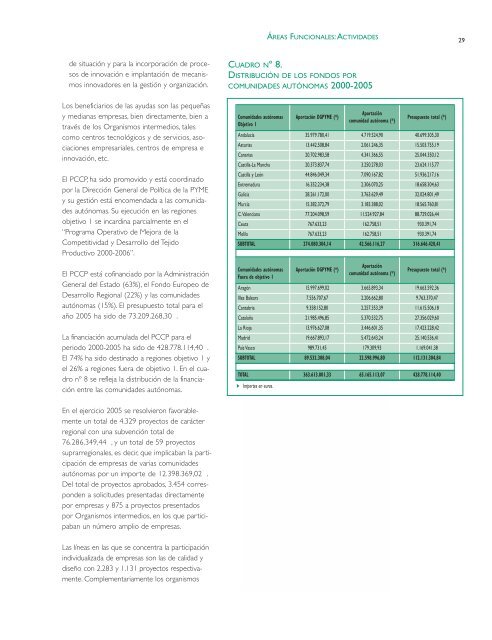
el 26% a regiones fuera <strong>de</strong> objetivo 1. En el cuadro<br />
nº 8 se refleja <strong>la</strong> distribución <strong>de</strong> <strong>la</strong> financiación<br />
entre <strong>la</strong>s comunida<strong>de</strong>s autónomas.<br />
CUADRO Nº 8.<br />
DISTRIBUCIÓN DE LOS FONDOS POR<br />
COMUNIDADES AUTÓNOMAS 2000-2005<br />
Comunida<strong>de</strong>s autónomas<br />
Objetivo 1<br />
TOTAL 363.613.001,33 65.165.113,07 428.778.114,40<br />
Importes en euros.<br />
Aportación DG<strong>PYME</strong> (*)<br />
Aportación<br />
comunidad autónoma (*)<br />
Presupuesto total (*)<br />
Andalucía 35.979.780,41 4.719.524,90 40.699.305,30<br />
Asturias 13.442.508,84 2.061.246,35 15.503.755,19<br />
Canarias 20.702.983,58 4.341.366,55 25.044.350,12<br />
Castil<strong>la</strong>-La Mancha 20.373.837,74 3.250.278,03 23.624.115,77<br />
Castil<strong>la</strong> y León 44.846.049,34 7.090.167,82 51.936.217,16<br />
Extremadura 16.352.234,38 2.306.070,25 18.658.304,63<br />
Galicia 28.261.172,00 3.763.629,49 32.024.801,49<br />
Murcia 15.382.372,79 3.183.388,02 18.565.760,81<br />
C.Valenciana 77.204.098,59 11.524.927,84 88.729.026,44<br />
Ceuta 767.633,23 162.758,51 930.391,74<br />
Meli<strong>la</strong> 767.633,23 162.758,51 930.391,74<br />
SUBTOTAL 274.080.304,14 42.566.116,27 316.646.420,41<br />
Comunida<strong>de</strong>s autónomas<br />
Fuera <strong>de</strong> objetivo 1<br />
Aportación DG<strong>PYME</strong> (*)<br />
Aportación<br />
comunidad autónoma (*)<br />
Presupuesto total (*)<br />
Aragón 15.997.699,02 3.665.893,34 19.663.592,36<br />
Illes Balears 7.556.707,67 2.206.662,80 9.763.370,47<br />
Cantabria 9.358.152,80 2.257.353,39 11.615.506,18<br />
Cataluña 21.985.496,85 5.370.532,75 27.356.029,60<br />
La Rioja 13.976.627,08 3.446.601,35 17.423.228,42<br />
Madrid 19.667.893,17 5.472.643,24 25.140.536,41<br />
País Vasco 989.731,45 179.309,93 1.169.041,38<br />
SUBTOTAL 89.532.308,04 22.598.996,80 112.131.304,84<br />
En el ejercicio 2005 se resolvieron favorablemente<br />
un total <strong>de</strong> 4.329 proyectos <strong>de</strong> carácter<br />
regional con una subvención total <strong>de</strong><br />
76.286.349,44 , y un total <strong>de</strong> 59 proyectos<br />
suprarregionales, es <strong>de</strong>cir, que implicaban <strong>la</strong> participación<br />
<strong>de</strong> empresas <strong>de</strong> varias comunida<strong>de</strong>s<br />
autónomas por un importe <strong>de</strong> 12.398.369,02 .<br />
Del total <strong>de</strong> proyectos aprobados, 3.454 correspon<strong>de</strong>n<br />
a solicitu<strong>de</strong>s presentadas directamente<br />
por empresas y 875 a proyectos presentados<br />
por Organismos intermedios, en los que participaban<br />
un número amplio <strong>de</strong> empresas.<br />
Las líneas en <strong>la</strong>s que se concentra <strong>la</strong> participación<br />
individualizada <strong>de</strong> empresas son <strong>la</strong>s <strong>de</strong> calidad y<br />
diseño con 2.283 y 1.131 proyectos respectivamente.<br />
Complementariamente los organismos