Memoria 2005. Dirección General de PolÃtica de la PYME
Memoria 2005. Dirección General de PolÃtica de la PYME
Memoria 2005. Dirección General de PolÃtica de la PYME

You also want an ePaper? Increase the reach of your titles
YUMPU automatically turns print PDFs into web optimized ePapers that Google loves.
VII DATOS ESTADÍSTICOS DE ENISA<br />
95<br />
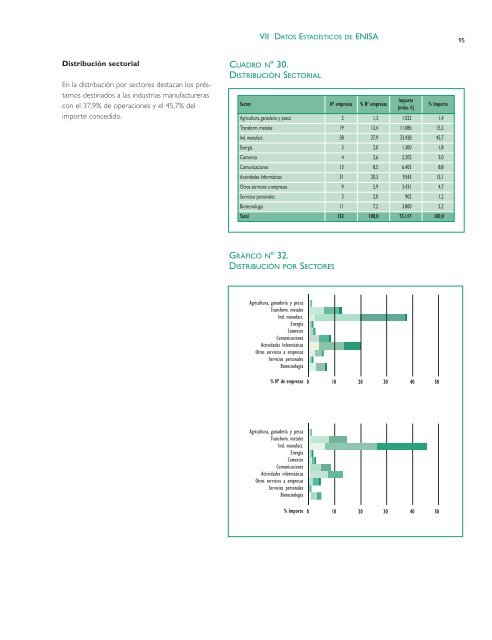
Distribución sectorial<br />
En <strong>la</strong> distribución por sectores <strong>de</strong>stacan los préstamos<br />
<strong>de</strong>stinados a <strong>la</strong>s industrias manufactureras<br />
con el 37,9% <strong>de</strong> operaciones y el 45,7% <strong>de</strong>l<br />
importe concedido.<br />
CUADRO Nº 30.<br />
DISTRIBUCIÓN SECTORIAL<br />
Sector Nº empresas % Nº empresas<br />
Importe<br />
(miles €)<br />
% Importe<br />
Agricultura, gana<strong>de</strong>ría y pesca 2 1,3 1.022 1,4<br />
Transform. metales 19 12,4 11.086 15,2<br />
Ind. manufact. 58 37,9 33.428 45,7<br />
Energía 3 2,0 1.300 1,8<br />
Comercio 4 2,6 2.202 3,0<br />
Comunicaciones 13 8,5 6.403 8,8<br />
Activida<strong>de</strong>s Informáticas 31 20,3 9.543 13,1<br />
Otros servicios a empresas 9 5,9 3.431 4,7<br />
Servicios personales 3 2,0 902 1,2<br />
Biotecnología 11 7,2 3.800 5,2<br />
Total 153 100,0 73.117 100,0<br />
GRÁFICO Nº 32.<br />
DISTRIBUCIÓN POR SECTORES<br />
Agricultura, gana<strong>de</strong>ría y pesca<br />
Transform. metales<br />
Ind. manufact.<br />
Energía<br />
Comercio<br />
Comunicaciones<br />
Activida<strong>de</strong>s Informáticas<br />
Otros servicios a empresas<br />
Servicios personales<br />
Biotecnología<br />
% Nº <strong>de</strong> empresas<br />
0 10 20 30 40 50<br />
Agricultura, gana<strong>de</strong>ría y pesca<br />
Transform. metales<br />
Ind. manufact.<br />
Energía<br />
Comercio<br />
Comunicaciones<br />
Activida<strong>de</strong>s informáticas<br />
Otros servicios a empresas<br />
Servicios personales<br />
Biotecnología<br />
% Importe 0 10 20 30 40 50