Memoria 2005. Dirección General de PolÃtica de la PYME
Memoria 2005. Dirección General de PolÃtica de la PYME
Memoria 2005. Dirección General de PolÃtica de la PYME

You also want an ePaper? Increase the reach of your titles
YUMPU automatically turns print PDFs into web optimized ePapers that Google loves.
VI DATOS ESTADÍSTICOS DE CERSA<br />
91<br />
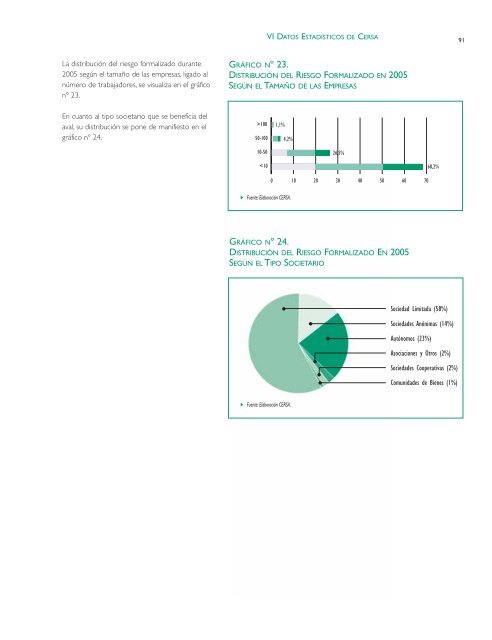
La distribución <strong>de</strong>l riesgo formalizado durante<br />
2005 según el tamaño <strong>de</strong> <strong>la</strong>s empresas, ligado al<br />
número <strong>de</strong> trabajadores, se visualiza en el gráfico<br />
nº 23.<br />
GRÁFICO Nº 23.<br />
DISTRIBUCIÓN DEL RIESGO FORMALIZADO EN 2005<br />
SEGÚN EL TAMAÑO DE LAS EMPRESAS<br />
En cuanto al tipo societario que se beneficia <strong>de</strong>l<br />
aval, su distribución se pone <strong>de</strong> manifiesto en el<br />
gráfico nº 24.<br />
>100<br />
50-100<br />
1,1%<br />
4,2%<br />
10-50<br />
26,5%<br />