Memoria 2005. Dirección General de PolÃtica de la PYME
Memoria 2005. Dirección General de PolÃtica de la PYME
Memoria 2005. Dirección General de PolÃtica de la PYME

Create successful ePaper yourself
Turn your PDF publications into a flip-book with our unique Google optimized e-Paper software.
VII DATOS ESTADÍSTICOS DE ENISA<br />
97<br />
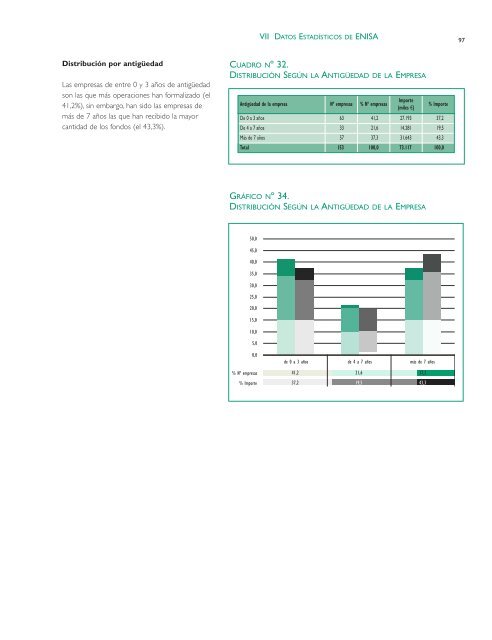
Distribución por antigüedad<br />
Las empresas <strong>de</strong> entre 0 y 3 años <strong>de</strong> antigüedad<br />
son <strong>la</strong>s que más operaciones han formalizado (el<br />
41,2%), sin embargo, han sido <strong>la</strong>s empresas <strong>de</strong><br />
más <strong>de</strong> 7 años <strong>la</strong>s que han recibido <strong>la</strong> mayor<br />
cantidad <strong>de</strong> los fondos (el 43,3%).<br />
CUADRO Nº 32.<br />
DISTRIBUCIÓN SEGÚN LA ANTIGÜEDAD DE LA EMPRESA<br />
Antigüedad <strong>de</strong> <strong>la</strong> empresa Nº empresas % Nº empresas<br />
Importe<br />
(miles €)<br />
% Importe<br />
De 0 a 3 años 63 41,2 27.193 37,2<br />
De 4 a 7 años 33 21,6 14.281 19,5<br />
Más <strong>de</strong> 7 años 57 37,3 31.643 43,3<br />
Total 153 100,0 73.117 100,0<br />
GRÁFICO Nº 34.<br />
DISTRIBUCIÓN SEGÚN LA ANTIGÜEDAD DE LA EMPRESA<br />
50,0<br />
45,0<br />
40,0<br />
35,0<br />
30,0<br />
25,0<br />
20,0<br />
15,0<br />
10,0<br />
5,0<br />
0,0<br />
<strong>de</strong> 0 a 3 años <strong>de</strong> 4 a 7 años más <strong>de</strong> 7 años<br />
% Nº empresas 41,2 21,6 37,3<br />
% Importe 37,2 19,5 43,3