Memoria 2005. Dirección General de PolÃtica de la PYME
Memoria 2005. Dirección General de PolÃtica de la PYME
Memoria 2005. Dirección General de PolÃtica de la PYME

Create successful ePaper yourself
Turn your PDF publications into a flip-book with our unique Google optimized e-Paper software.
96<br />
VII DATOS ESTADÍSTICOS DE ENISA<br />
CUADRO Nº 31.<br />
DISTRIBUCIÓN SEGÚN EL TAMAÑO DE LAS EMPRESAS<br />
Nº <strong>de</strong> empleados Nº empresas % Nº empresas<br />
Importe<br />
(miles €)<br />
% Importe<br />
De 0 a 9 33 21,6 11.504 15,7<br />
De 10 a 49 66 43,1 29.524 40,4<br />
De 50 a 99 31 20,3 17.845 24,4<br />
De 100 a 250 23 15,0 14.244 19,5<br />
Total 153 100,0 73.117 100,0<br />
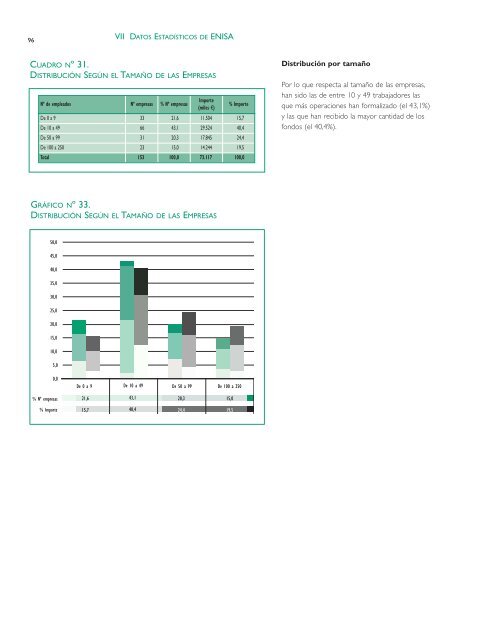
Distribución por tamaño<br />
Por lo que respecta al tamaño <strong>de</strong> <strong>la</strong>s empresas,<br />
han sido <strong>la</strong>s <strong>de</strong> entre 10 y 49 trabajadores <strong>la</strong>s<br />
que más operaciones han formalizado (el 43,1%)<br />
y <strong>la</strong>s que han recibido <strong>la</strong> mayor cantidad <strong>de</strong> los<br />
fondos (el 40,4%).<br />
GRÁFICO Nº 33.<br />
DISTRIBUCIÓN SEGÚN EL TAMAÑO DE LAS EMPRESAS<br />
50,0<br />
45,0<br />
40,0<br />
35,0<br />
30,0<br />
25,0<br />
20,0<br />
15,0<br />
10,0<br />
5,0<br />
0,0<br />
De 0 a 9 De 10 a 49 De 50 a 99 De 100 a 250<br />
% Nº empresas 21,6 43,1 20,3 15,0<br />
% Importe 15,7 40,4 24,4 19,5