Memoria 2005. Dirección General de PolÃtica de la PYME
Memoria 2005. Dirección General de PolÃtica de la PYME
Memoria 2005. Dirección General de PolÃtica de la PYME

Create successful ePaper yourself
Turn your PDF publications into a flip-book with our unique Google optimized e-Paper software.
38<br />
ÁREAS FUNCIONALES:ACTIVIDADES<br />
CUADRO Nº 12.<br />
DISTRIBUCIÓN DE EMPRESAS POR SECTORES<br />
Sector Total Empresas Trabajadores 1 Socios<br />
Servicios 598 734 1.171<br />
Comercio 410 524 796<br />
Construcción 134 174 229<br />
Industria 56 71 101<br />
Transporte 55 67 107<br />
Agricultura 8 10 18<br />
Total 1.261 1.580 2.422<br />
Empresas constituidas por procedimiento presencial 2<br />
Durante el año 2005, se emitieron por este procedimiento<br />
4.959 certificaciones <strong>de</strong> reserva <strong>de</strong><br />
<strong>de</strong>nominación social para SLNEs, inscribiéndose<br />
3.484 socieda<strong>de</strong>s en los registros mercantiles<br />
provinciales correspondientes.<br />
1 Esta cifra incluye tanto trabajadores por cuenta ajena como socios trabajadores.<br />
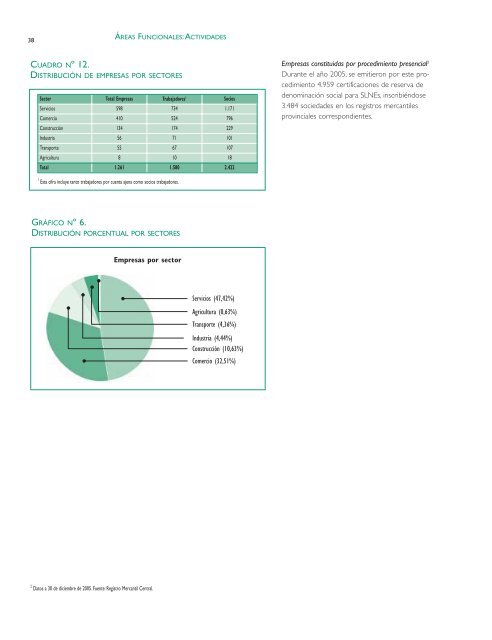
GRÁFICO Nº 6.<br />
DISTRIBUCIÓN PORCENTUAL POR SECTORES<br />
Empresas por sector<br />
Servicios (47,42%)<br />
Agricultura (0,63%)<br />
Transporte (4,36%)<br />
Industria (4,44%)<br />
Construcción (10,63%)<br />
Comercio (32,51%)<br />
2 Datos a 30 <strong>de</strong> diciembre <strong>de</strong> <strong>2005.</strong> Fuente: Registro Mercantil Central.