Memoria 2005. Dirección General de PolÃtica de la PYME
Memoria 2005. Dirección General de PolÃtica de la PYME
Memoria 2005. Dirección General de PolÃtica de la PYME

Create successful ePaper yourself
Turn your PDF publications into a flip-book with our unique Google optimized e-Paper software.
56<br />
SOCIEDADES INSTRUMENTALES:ACTIVIDADES<br />
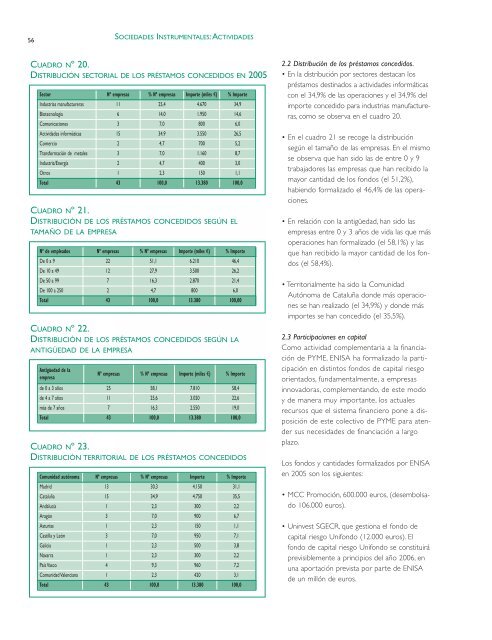
CUADRO Nº 20.<br />
DISTRIBUCIÓN SECTORIAL DE LOS PRÉSTAMOS CONCEDIDOS EN 2005<br />
Sector Nº empresas % Nº empresas Importe (miles €) % Importe<br />
Industrias manufactureras 11 25,4 4.670 34,9<br />
Biotecnología 6 14,0 1.950 14,6<br />
Comunicaciones 3 7,0 800 6,0<br />
Activida<strong>de</strong>s informáticas 15 34,9 3.550 26,5<br />
Comercio 2 4,7 700 5,2<br />
Transformación <strong>de</strong> metales 3 7,0 1.160 8,7<br />
Industria/Energía 2 4,7 400 3,0<br />
Otros 1 2,3 150 1,1<br />
Total 43 100,0 13.380 100,0<br />
CUADRO Nº 21.<br />
DISTRIBUCIÓN DE LOS PRÉSTAMOS CONCEDIDOS SEGÚN EL<br />
TAMAÑO DE LA EMPRESA<br />
Nº <strong>de</strong> empleados Nº empresas % Nº empresas Importe (miles €) % Importe<br />
De 0 a 9 22 51,1 6.210 46,4<br />
De 10 a 49 12 27,9 3.500 26,2<br />
De 50 a 99 7 16,3 2.870 21,4<br />
De 100 a 250 2 4,7 800 6,0<br />
Total 43 100,0 13.380 100,00<br />
CUADRO Nº 22.<br />
DISTRIBUCIÓN DE LOS PRÉSTAMOS CONCEDIDOS SEGÚN LA<br />
ANTIGÜEDAD DE LA EMPRESA<br />
Antigüedad <strong>de</strong> <strong>la</strong><br />
empresa<br />
Nº empresas % Nº empresas Importe (miles €) % Importe<br />
<strong>de</strong> 0 a 3 años 25 58,1 7.810 58,4<br />
<strong>de</strong> 4 a 7 años 11 25,6 3.020 22,6<br />
más <strong>de</strong> 7 años 7 16,3 2.550 19,0<br />
Total 43 100,0 13.380 100,0<br />
CUADRO Nº 23.<br />
DISTRIBUCIÓN TERRITORIAL DE LOS PRÉSTAMOS CONCEDIDOS<br />
Comunidad autónoma Nº empresas % Nº empresas Importe % Importe<br />
Madrid 13 30,3 4.150 31,1<br />
Cataluña 15 34,9 4.750 35,5<br />
Andalucía 1 2,3 300 2,2<br />
Aragón 3 7,0 900 6,7<br />
Asturias 1 2,3 150 1,1<br />
Castil<strong>la</strong> y León 3 7,0 950 7,1<br />
Galicia 1 2,3 500 3,8<br />
Navarra 1 2,3 300 2,2<br />
País Vasco 4 9,3 960 7,2<br />
Comunidad Valenciana 1 2,3 420 3,1<br />
Total 43 100,0 13.380 100,0<br />
2.2 Distribución <strong>de</strong> los préstamos concedidos.<br />
• En <strong>la</strong> distribución por sectores <strong>de</strong>stacan los<br />
préstamos <strong>de</strong>stinados a activida<strong>de</strong>s informáticas<br />
con el 34,9% <strong>de</strong> <strong>la</strong>s operaciones y el 34,9% <strong>de</strong>l<br />
importe concedido para industrias manufactureras,<br />
como se observa en el cuadro 20.<br />
• En el cuadro 21 se recoge <strong>la</strong> distribución<br />
según el tamaño <strong>de</strong> <strong>la</strong>s empresas. En el mismo<br />
se observa que han sido <strong>la</strong>s <strong>de</strong> entre 0 y 9<br />
trabajadores <strong>la</strong>s empresas que han recibido <strong>la</strong><br />
mayor cantidad <strong>de</strong> los fondos (el 51,2%),<br />
habiendo formalizado el 46,4% <strong>de</strong> <strong>la</strong>s operaciones.<br />
• En re<strong>la</strong>ción con <strong>la</strong> antigüedad, han sido <strong>la</strong>s<br />
empresas entre 0 y 3 años <strong>de</strong> vida <strong>la</strong>s que más<br />
operaciones han formalizado (el 58,1%) y <strong>la</strong>s<br />
que han recibido <strong>la</strong> mayor cantidad <strong>de</strong> los fondos<br />
(el 58,4%).<br />
• Territorialmente ha sido <strong>la</strong> Comunidad<br />
Autónoma <strong>de</strong> Cataluña don<strong>de</strong> más operaciones<br />
se han realizado (el 34,9%) y don<strong>de</strong> más<br />
importes se han concedido (el 35,5%).<br />
2.3 Participaciones en capital<br />
Como actividad complementaria a <strong>la</strong> financiación<br />
<strong>de</strong> <strong>PYME</strong>, ENISA ha formalizado <strong>la</strong> participación<br />
en distintos fondos <strong>de</strong> capital riesgo<br />
orientados, fundamentalmente, a empresas<br />
innovadoras, complementando, <strong>de</strong> este modo<br />
y <strong>de</strong> manera muy importante, los actuales<br />
recursos que el sistema financiero pone a disposición<br />
<strong>de</strong> este colectivo <strong>de</strong> <strong>PYME</strong> para aten<strong>de</strong>r<br />
sus necesida<strong>de</strong>s <strong>de</strong> financiación a <strong>la</strong>rgo<br />
p<strong>la</strong>zo.<br />
Los fondos y cantida<strong>de</strong>s formalizados por ENISA<br />
en 2005 son los siguientes:<br />
• MCC Promoción, 600.000 euros, (<strong>de</strong>sembolsado<br />
106.000 euros).<br />
• Uninvest SGECR, que gestiona el fondo <strong>de</strong><br />
capital riesgo Unifondo (12.000 euros). El<br />
fondo <strong>de</strong> capital riesgo Unifondo se constituirá<br />
previsiblemente a principios <strong>de</strong>l año 2006, en<br />
una aportación prevista por parte <strong>de</strong> ENISA<br />
<strong>de</strong> un millón <strong>de</strong> euros.