Programa Sectorial de Comunicaciones y Transportes 2007 - Seneam
Programa Sectorial de Comunicaciones y Transportes 2007 - Seneam
Programa Sectorial de Comunicaciones y Transportes 2007 - Seneam

Create successful ePaper yourself
Turn your PDF publications into a flip-book with our unique Google optimized e-Paper software.
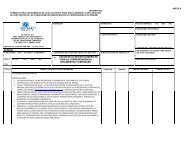
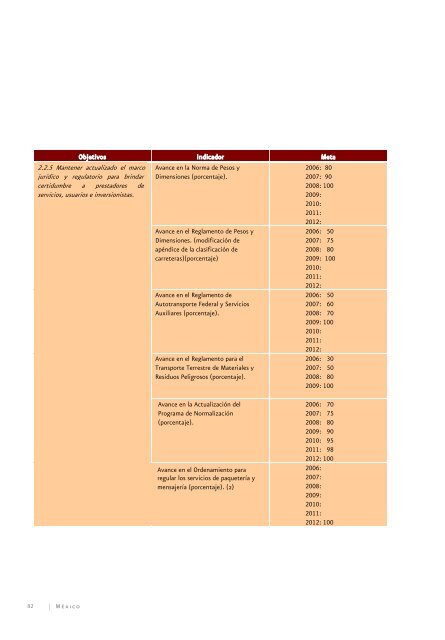
Objetivos Indicador Meta<br />
Cursos y reconocimientos a instructores<br />
<strong>de</strong>l autotransporte.<br />
2006: 54<br />
<strong>2007</strong>: 54<br />
2008: 54<br />
2009: 60<br />
2010: 60<br />
2011: 65 65<br />
2012: 70 70<br />
2.2.4. Participar en los mercados<br />
Vehículos <strong>de</strong> carga mexicanos<br />
2006: 0<br />
mundiales, bajo criterios <strong>de</strong><br />
operando en los EUA más allá <strong>de</strong> la<br />
<strong>2007</strong>: 100<br />
reciprocidad efectiva y oportunida<strong>de</strong>s<br />
zona fronteriza.<br />
2008: 300<br />
<strong>Programa</strong> <strong>Sectorial</strong> <strong>de</strong> <strong>Comunicaciones</strong> y <strong>Transportes</strong><br />
equitativas, con la finalidad <strong>de</strong><br />
<strong>2007</strong>-2012<br />
2009: 1,000<br />
impulsar el comercio exterior y<br />
2010: 1,500<br />
disminuir los costos logísticos.<br />
2011: 2,000<br />
Objetivos Indicador 2012: Meta 3,000<br />
2.2.5 Mantener actualizado el el marco<br />
Avance Trámites en en la Norma línea (porcentaje). <strong>de</strong> Pesos y<br />
2006: 80<br />
20<br />
jurídico y regulatorio para brindar<br />
Dimensiones (porcentaje).<br />
<strong>2007</strong>: 90 90 30<br />
certidumbre a prestadores <strong>de</strong><br />
2008: 100<br />
40<br />
servicios, usuarios e inversionistas.<br />
2009:<br />
60<br />
2010:<br />
75<br />
2011:<br />
85<br />
2012:<br />
100<br />
2.2.3. Reforzar las medidas <strong>de</strong> Avance Acci<strong>de</strong>ntes el en Reglamento carreteras fe<strong>de</strong>rales. Pesos y<br />
2006: 29,078 50<br />
seguridad a fin <strong>de</strong> garantizar la<br />
integridad <strong>de</strong> los usuarios <strong>de</strong> las vías<br />
generales <strong>de</strong> comunicación.<br />
Dimensiones. (modificación <strong>de</strong><br />
apéndice <strong>de</strong> la clasificación <strong>de</strong><br />
carreteras)(porcentaje)<br />
<strong>2007</strong>: 28,642 75<br />
2008: 28,212 80<br />
2009: 27,789 100<br />
2010:<br />
27,372<br />
2011:26,962<br />
2012:<br />
26,557<br />
Avance Índice <strong>de</strong> en acci<strong>de</strong>ntes el Reglamento por millón <strong>de</strong><br />
<strong>de</strong><br />
Autotransporte vehículo-Km. Fe<strong>de</strong>ral y Servicios<br />
Auxiliares (porcentaje).<br />
2006: 0.2582 50<br />
<strong>2007</strong>: 0.2506 60<br />
2008: 0.2432 70<br />
2009: 100<br />
0.2360<br />
2010:<br />
0.2290<br />
2011:<br />
0.2223<br />
2012:<br />
0.2157<br />
Avance Inspecciones en el Reglamento a empresas <strong>de</strong> para carga el<br />
y<br />
Transporte pasaje. Terrestre <strong>de</strong> Materiales y<br />
Residuos Peligrosos (porcentaje).<br />
2006: 2,513 30<br />
<strong>2007</strong>: 2,960 50<br />
2008: 3,256 80<br />
2009: 100<br />
3,581<br />
Avance en la Actualización <strong>de</strong>l<br />
<strong>Programa</strong> <strong>de</strong> Normalización<br />
2010: 3,940<br />
2006: 2011: 4,334 70<br />
<strong>2007</strong>: 2012: 4,767 75<br />
(porcentaje).<br />
Inspecciones a empresas que<br />
2008: 80<br />
2009: 90<br />
2010: 95<br />
2011: 98 98<br />
2012: 2006: 100<br />
229<br />
transportan Avence Avance en el materiales Or<strong>de</strong>namiento y residuos<br />
para<br />
2006:<br />
<strong>2007</strong>: 508<br />
peligrosos.<br />
regular los servicios <strong>de</strong> paquetería y<br />
<strong>2007</strong>:<br />
2008: 523<br />
mensajería (porcentaje). (2)<br />
2008:<br />
2009: 555<br />
2009:<br />
2010: 577<br />
2010:<br />
2011: 600<br />
2011:<br />
2012: 633<br />
Verificaciones <strong>de</strong> peso y dimensiones. 2012: 2006: 100<br />
157,040<br />
<strong>2007</strong>: 172,744<br />
2008: 176,199<br />
2009: 185,009<br />
24<br />
2010: 194,259<br />
2011: 203,972<br />
2012: 214,170<br />
82 M é x i c o<br />
Verificaciones <strong>de</strong> condiciones físicomecánicas<br />
a unida<strong>de</strong>s vehiculares <strong>de</strong><br />
carga y pasaje. (1)<br />
2006: 0<br />
<strong>2007</strong>: 0<br />
2008: 0<br />
2009: 2,000<br />
2010: 373,156<br />
2011: 392,567