CapÃtulo 4 EVOLUCIÃN DE LA ACTIVIDAD COMERCIAL
CapÃtulo 4 EVOLUCIÃN DE LA ACTIVIDAD COMERCIAL
CapÃtulo 4 EVOLUCIÃN DE LA ACTIVIDAD COMERCIAL

Create successful ePaper yourself
Turn your PDF publications into a flip-book with our unique Google optimized e-Paper software.
La distribución comercial en España en 2009<br />
100<br />
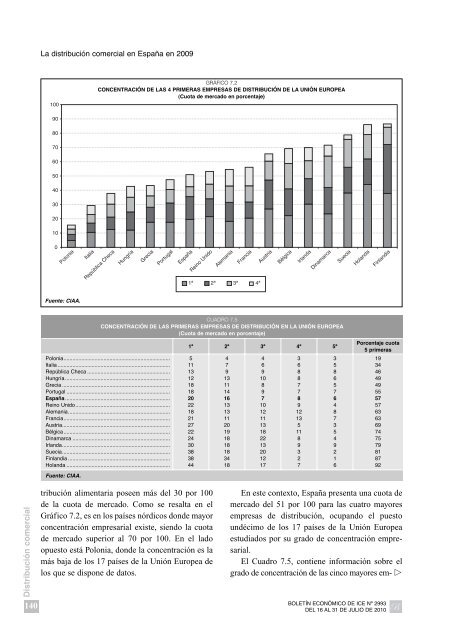
GRÁFICO 7.2<br />
CONCENTRACIÓN <strong>DE</strong> <strong>LA</strong>S 4 PRIMERAS EMPRESAS <strong>DE</strong> DISTRIBUCIÓN <strong>DE</strong> <strong>LA</strong> UNIÓN EUROPEA<br />
(Cuota de mercado en porcentaje)<br />
90<br />
80<br />
70<br />
60<br />
50<br />
40<br />
30<br />
20<br />
10<br />
0<br />
Polonia<br />
Italia<br />
República Checa<br />
Hungría<br />
Grecia<br />
Portugal<br />
España<br />
Reino Unido<br />
Alemania<br />
Francia<br />
1ª 2ª 3ª 4ª<br />
Austria<br />
Bélgica<br />
Irlanda<br />
Dinamarca<br />
Suecia<br />
Holanda<br />
Finlandia<br />
Fuente: CIAA.<br />
CUADRO 7.5<br />
CONCENTRACIÓN <strong>DE</strong> <strong>LA</strong>S PRIMERAS EMPRESAS <strong>DE</strong> DISTRIBUCIÓN EN <strong>LA</strong> UNIÓN EUROPEA<br />
(Cuota de mercado en porcentaje)<br />
1ª 2ª 3ª 4ª 5ª<br />
Porcentaje cuota<br />
5 primeras<br />
Polonia........................................................................ 5 4 4 3 3 19<br />
Italia ............................................................................ 11 7 6 6 5 34<br />
República Checa ........................................................ 13 9 9 8 8 46<br />
Hungría....................................................................... 12 13 10 8 6 49<br />
Grecia ......................................................................... 18 11 8 7 5 49<br />
Portugal ...................................................................... 18 14 9 7 7 55<br />
España....................................................................... 20 16 7 8 6 57<br />
Reino Unido................................................................ 22 13 10 9 4 57<br />
Alemania..................................................................... 18 13 12 12 8 63<br />
Francia........................................................................ 21 11 11 13 7 63<br />
Austria......................................................................... 27 20 13 5 3 69<br />
Bélgica........................................................................ 22 19 18 11 5 74<br />
Dinamarca .................................................................. 24 18 22 8 4 75<br />
Irlanda......................................................................... 30 18 13 9 9 79<br />
Suecia......................................................................... 38 18 20 3 2 81<br />
Finlandia ..................................................................... 38 34 12 2 1 87<br />
Holanda ...................................................................... 44 18 17 7 6 92<br />
Fuente: CIAA.<br />
Distribución comercial<br />
140<br />
tribución alimentaria poseen más del 30 por 100<br />
de la cuota de mercado. Como se resalta en el<br />
Gráfico 7.2, es en los países nórdicos donde mayor<br />
concentración empresarial existe, siendo la cuota<br />
de mercado superior al 70 por 100. En el lado<br />
opuesto está Polonia, donde la concentración es la<br />
más baja de los 17 países de la Unión Europea de<br />
los que se dispone de datos.<br />
En este contexto, España presenta una cuota de<br />
mercado del 51 por 100 para las cuatro mayores<br />
empresas de distribución, ocupando el puesto<br />
undécimo de los 17 países de la Unión Europea<br />
estudiados por su grado de concentración empresarial.<br />
El Cuadro 7.5, contiene información sobre el<br />
grado de concentración de las cinco mayores em- <br />
BOLETÍN ECONÓMICO <strong>DE</strong> ICE Nº 2993<br />
<strong>DE</strong>L 16 AL 31 <strong>DE</strong> JULIO <strong>DE</strong> 2010