Prospectiva de Petróleo Crudo 2012 - 2006 - SecretarÃa de EnergÃa
Prospectiva de Petróleo Crudo 2012 - 2006 - SecretarÃa de EnergÃa
Prospectiva de Petróleo Crudo 2012 - 2006 - SecretarÃa de EnergÃa

You also want an ePaper? Increase the reach of your titles
YUMPU automatically turns print PDFs into web optimized ePapers that Google loves.
SECRETARÍA DE ENERGÍA<br />
90,000<br />
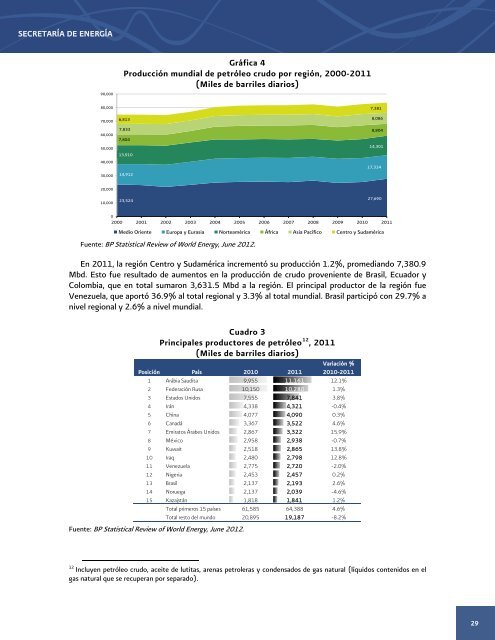
Gráfica 4<br />
Producción mundial <strong>de</strong> petróleo crudo por región, 2000-2011<br />
(Miles <strong>de</strong> barriles diarios)<br />
80,000<br />
7,381<br />
70,000<br />
60,000<br />
50,000<br />
40,000<br />
30,000<br />
6,813<br />
7,833<br />
7,804<br />
13,910<br />
14,912<br />
8,086<br />
8,804<br />
14,301<br />
17,314<br />
20,000<br />
10,000<br />
23,524<br />
27,690<br />
0<br />
2000 2001 2002 2003 2004 2005 <strong>2006</strong> 2007 2008 2009 2010 2011<br />
Medio Oriente Europa y Eurasia Norteamérica África Asia Pacífico Centro y Sudamérica<br />
Fuente: BP Statistical Review of World Energy, June <strong>2012</strong>.<br />
En 2011, la región Centro y Sudamérica incrementó su producción 1.2%, promediando 7,380.9<br />
Mbd. Esto fue resultado <strong>de</strong> aumentos en la producción <strong>de</strong> crudo proveniente <strong>de</strong> Brasil, Ecuador y<br />
Colombia, que en total sumaron 3,631.5 Mbd a la región. El principal productor <strong>de</strong> la región fue<br />
Venezuela, que aportó 36.9% al total regional y 3.3% al total mundial. Brasil participó con 29.7% a<br />
nivel regional y 2.6% a nivel mundial.<br />
Cuadro 3<br />
Principales productores <strong>de</strong> petróleo 12 , 2011<br />
(Miles <strong>de</strong> barriles diarios)<br />
Posición País 2010 2011<br />
Variación %<br />
2010-2011<br />
1 Arábia Saudita 9,955 11,161 12.1%<br />
2 Fe<strong>de</strong>ración Rusa 10,150 10,280 1.3%<br />
3 Estados Unidos 7,555 7,841 3.8%<br />
4 Irán 4,338 4,321 -0.4%<br />
5 China 4,077 4,090 0.3%<br />
6 Canadá 3,367 3,522 4.6%<br />
7 Emiratos Árabes Unidos 2,867 3,322 15.9%<br />
8 México 2,958 2,938 -0.7%<br />
9 Kuwait 2,518 2,865 13.8%<br />
10 Iraq 2,480 2,798 12.8%<br />
11 Venezuela 2,775 2,720 -2.0%<br />
12 Nigeria 2,453 2,457 0.2%<br />
13 Brasil 2,137 2,193 2.6%<br />
14 Noruega 2,137 2,039 -4.6%<br />
15 Kazajstán 1,818 1,841 1.2%<br />
Total primeros 15 países 61,585 64,388 4.6%<br />
Total resto <strong>de</strong>l mundo 20,895 19,187 -8.2%<br />
Fuente: BP Statistical Review of World Energy, June <strong>2012</strong>.<br />
12<br />
Incluyen petróleo crudo, aceite <strong>de</strong> lutitas, arenas petroleras y con<strong>de</strong>nsados <strong>de</strong> gas natural (líquidos contenidos en el<br />
gas natural que se recuperan por separado).<br />
29