Prospectiva de Petróleo Crudo 2012 - 2006 - SecretarÃa de EnergÃa
Prospectiva de Petróleo Crudo 2012 - 2006 - SecretarÃa de EnergÃa
Prospectiva de Petróleo Crudo 2012 - 2006 - SecretarÃa de EnergÃa

You also want an ePaper? Increase the reach of your titles
YUMPU automatically turns print PDFs into web optimized ePapers that Google loves.
SECRETARÍA DE ENERGÍA<br />
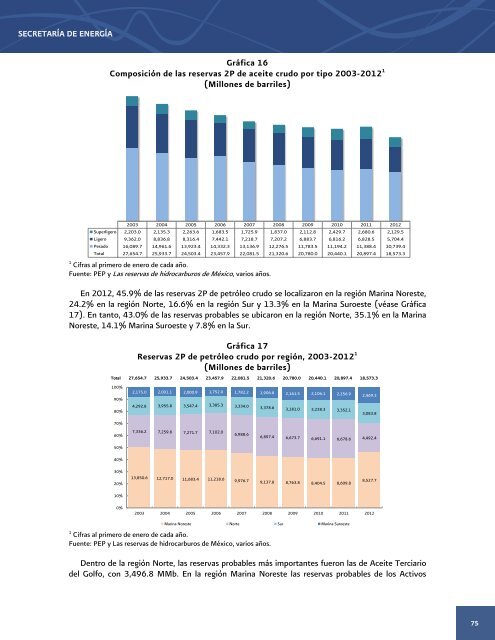
Gráfica 16<br />
Composición <strong>de</strong> las reservas 2P <strong>de</strong> aceite crudo por tipo 2003-<strong>2012</strong> 1<br />
(Millones <strong>de</strong> barriles)<br />
2003 2004 2005 <strong>2006</strong> 2007 2008 2009 2010 2011 <strong>2012</strong><br />
Superligero 2,203.0 2,135.3 2,263.6 1,683.5 1,725.9 1,837.0 2,112.8 2,429.7 2,680.6 2,129.5<br />
Ligero 9,362.0 8,836.8 8,316.4 7,442.1 7,218.7 7,207.2 6,883.7 6,816.2 6,828.5 5,704.4<br />
Pesado 16,089.7 14,961.6 13,923.4 14,332.3 13,136.9 12,276.5 11,783.5 11,194.2 11,388.4 10,739.4<br />
Total 27,654.7 25,933.7 24,503.4 23,457.9 22,081.5 21,320.6 20,780.0 20,440.1 20,897.4 18,573.3<br />
1<br />
Cifras al primero <strong>de</strong> enero <strong>de</strong> cada año.<br />
Fuente: PEP y Las reservas <strong>de</strong> hidrocarburos <strong>de</strong> México, varios años.<br />
En <strong>2012</strong>, 45.9% <strong>de</strong> las reservas 2P <strong>de</strong> petróleo crudo se localizaron en la región Marina Noreste,<br />
24.2% en la región Norte, 16.6% en la región Sur y 13.3% en la Marina Suroeste (véase Gráfica<br />
17). En tanto, 43.0% <strong>de</strong> las reservas probables se ubicaron en la región Norte, 35.1% en la Marina<br />
Noreste, 14.1% Marina Suroeste y 7.8% en la Sur.<br />
Gráfica 17<br />
Reservas 2P <strong>de</strong> petróleo crudo por región, 2003-<strong>2012</strong> 1<br />
(Millones <strong>de</strong> barriles)<br />
Total 27,654.7 25,933.7 24,503.4 23,457.9 22,081.5 21,320.6 20,780.0 20,440.1 20,897.4 18,573.3<br />
100%<br />
90%<br />
2,175.0 2,001.1 2,000.9 1,752.0 1,782.2 1,906.8 2,161.5 2,106.1 2,256.9 2,469.3<br />
80%<br />
4,292.8 3,955.8 3,547.4 3,385.3 3,334.0 3,378.6 3,181.0 3,238.3 3,352.1<br />
3,083.8<br />
70%<br />
60%<br />
7,336.2 7,259.8 7,271.7 7,102.0<br />
6,988.6<br />
6,897.4 6,673.7 6,691.1 6,678.6 4,492.4<br />
50%<br />
40%<br />
30%<br />
20%<br />
10%<br />
13,850.6 12,717.0 11,683.4 11,218.6 9,976.7 9,137.8 8,763.8 8,404.5 8,609.8<br />
8,527.7<br />
0%<br />
2003 2004 2005 <strong>2006</strong> 2007 2008 2009 2010 2011 <strong>2012</strong><br />
Marina Noreste Norte Sur Marina Suroeste<br />
1<br />
Cifras al primero <strong>de</strong> enero <strong>de</strong> cada año.<br />
Fuente: PEP y Las reservas <strong>de</strong> hidrocarburos <strong>de</strong> México, varios años.<br />
Dentro <strong>de</strong> la región Norte, las reservas probables más importantes fueron las <strong>de</strong> Aceite Terciario<br />
<strong>de</strong>l Golfo, con 3,496.8 MMb. En la región Marina Noreste las reservas probables <strong>de</strong> los Activos<br />
75