Prospectiva de Petróleo Crudo 2012 - 2006 - SecretarÃa de EnergÃa
Prospectiva de Petróleo Crudo 2012 - 2006 - SecretarÃa de EnergÃa
Prospectiva de Petróleo Crudo 2012 - 2006 - SecretarÃa de EnergÃa

Create successful ePaper yourself
Turn your PDF publications into a flip-book with our unique Google optimized e-Paper software.
PROSPECTIVA DE PETRÓLEO CRUDO <strong>2012</strong>-2026<br />
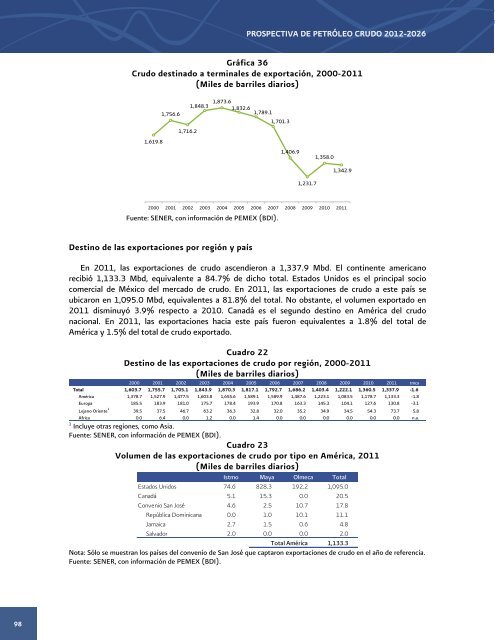
Gráfica 36<br />
<strong>Crudo</strong> <strong>de</strong>stinado a terminales <strong>de</strong> exportación, 2000-2011<br />
(Miles <strong>de</strong> barriles diarios)<br />
1,756.6<br />
1,848.3 1,873.6 1,832.6 1,789.1<br />
1,701.3<br />
1,619.8<br />
1,716.2<br />
1,406.9<br />
1,358.0<br />
1,342.9<br />
1,231.7<br />
2000 2001 2002 2003 2004 2005 <strong>2006</strong> 2007 2008 2009 2010 2011<br />
Fuente: SENER, con información <strong>de</strong> PEMEX (BDI).<br />
Destino <strong>de</strong> las exportaciones por región y país<br />
En 2011, las exportaciones <strong>de</strong> crudo ascendieron a 1,337.9 Mbd. El continente americano<br />
recibió 1,133.3 Mbd, equivalente a 84.7% <strong>de</strong> dicho total. Estados Unidos es el principal socio<br />
comercial <strong>de</strong> México <strong>de</strong>l mercado <strong>de</strong> crudo. En 2011, las exportaciones <strong>de</strong> crudo a este país se<br />
ubicaron en 1,095.0 Mbd, equivalentes a 81.8% <strong>de</strong>l total. No obstante, el volumen exportado en<br />
2011 disminuyó 3.9% respecto a 2010. Canadá es el segundo <strong>de</strong>stino en América <strong>de</strong>l crudo<br />
nacional. En 2011, las exportaciones hacia este país fueron equivalentes a 1.8% <strong>de</strong>l total <strong>de</strong><br />
América y 1.5% <strong>de</strong>l total <strong>de</strong> crudo exportado.<br />
Cuadro 22<br />
Destino <strong>de</strong> las exportaciones <strong>de</strong> crudo por región, 2000-2011<br />
(Miles <strong>de</strong> barriles diarios)<br />
2000 2001 2002 2003 2004 2005 <strong>2006</strong> 2007 2008 2009 2010 2011 tmca<br />
Total 1,603.7 1,755.7 1,705.1 1,843.9 1,870.3 1,817.1 1,792.7 1,686.2 1,403.4 1,222.1 1,360.5 1,337.9 -1.6<br />
América 1,378.7 1,527.9 1,477.5 1,603.8 1,655.6 1,589.1 1,589.9 1,487.6 1,223.1 1,083.5 1,178.7 1,133.3 -1.8<br />
Europa 185.5 183.9 181.0 175.7 178.4 193.9 170.8 163.3 145.3 104.1 127.6 130.8 -3.1<br />
Lejano Oriente 1 39.5 37.5 46.7 63.2 36.3 32.8 32.0 35.2 34.9 34.5 54.3 73.7 5.8<br />
Africa 0.0 6.4 0.0 1.2 0.0 1.4 0.0 0.0 0.0 0.0 0.0 0.0 n.a.<br />
1<br />
Incluye otras regiones, como Asia.<br />
Fuente: SENER, con información <strong>de</strong> PEMEX (BDI).<br />
Cuadro 23<br />
Volumen <strong>de</strong> las exportaciones <strong>de</strong> crudo por tipo en América, 2011<br />
(Miles <strong>de</strong> barriles diarios)<br />
Istmo Maya Olmeca Total<br />
Estados Unidos 74.6 828.3 192.2 1,095.0<br />
Canadá 5.1 15.3 0.0 20.5<br />
Convenio San José 4.6 2.5 10.7 17.8<br />
República Dominicana 0.0 1.0 10.1 11.1<br />
Jamaica 2.7 1.5 0.6 4.8<br />
Salvador 2.0 0.0 0.0 2.0<br />
Total América 1,133.3<br />
Nota: Sólo se muestran los países <strong>de</strong>l convenio <strong>de</strong> San José que captaron exportaciones <strong>de</strong> crudo en el año <strong>de</strong> referencia.<br />
Fuente: SENER, con información <strong>de</strong> PEMEX (BDI).<br />
98