Prospectiva de Petróleo Crudo 2012 - 2006 - SecretarÃa de EnergÃa
Prospectiva de Petróleo Crudo 2012 - 2006 - SecretarÃa de EnergÃa
Prospectiva de Petróleo Crudo 2012 - 2006 - SecretarÃa de EnergÃa

You also want an ePaper? Increase the reach of your titles
YUMPU automatically turns print PDFs into web optimized ePapers that Google loves.
SECRETARÍA DE ENERGÍA<br />
Cuadro 10<br />
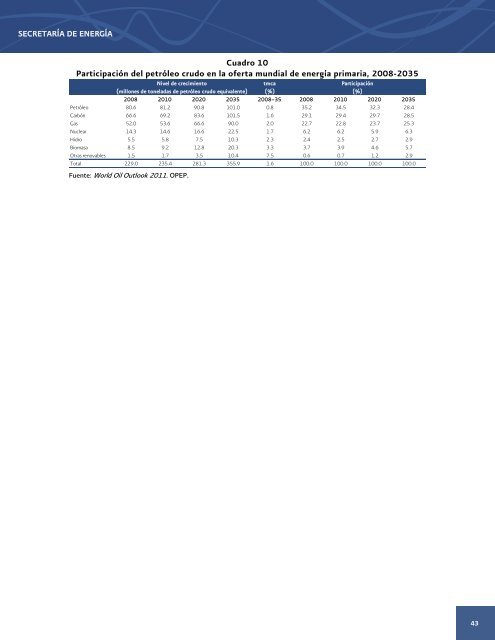
Participación <strong>de</strong>l petróleo crudo en la oferta mundial <strong>de</strong> energía primaria, 2008-2035<br />
Nivel <strong>de</strong> crecimiento<br />
tmca<br />
Participación<br />
(millones <strong>de</strong> toneladas <strong>de</strong> petróleo crudo equivalente) (%)<br />
(%)<br />
2008 2010 2020 2035 2008–35 2008 2010 2020 2035<br />
Petróleo 80.6 81.2 90.8 101.0 0.8 35.2 34.5 32.3 28.4<br />
Carbón 66.6 69.2 83.6 101.5 1.6 29.1 29.4 29.7 28.5<br />
Gas 52.0 53.6 66.6 90.0 2.0 22.7 22.8 23.7 25.3<br />
Nuclear 14.3 14.6 16.6 22.5 1.7 6.2 6.2 5.9 6.3<br />
Hidro 5.5 5.8 7.5 10.3 2.3 2.4 2.5 2.7 2.9<br />
Biomasa 8.5 9.2 12.8 20.3 3.3 3.7 3.9 4.6 5.7<br />
Otras renovables 1.5 1.7 3.5 10.4 7.5 0.6 0.7 1.2 2.9<br />
Total 229.0 235.4 281.3 355.9 1.6 100.0 100.0 100.0 100.0<br />
Fuente: World Oil Outlook 2011. OPEP.<br />
43