Dynamiques de déforestation dans le bassin du Congo
Dynamiques de déforestation dans le bassin du Congo
Dynamiques de déforestation dans le bassin du Congo
You also want an ePaper? Increase the reach of your titles
YUMPU automatically turns print PDFs into web optimized ePapers that Google loves.
Tab<strong>le</strong> <strong>de</strong>s Matières ix<br />
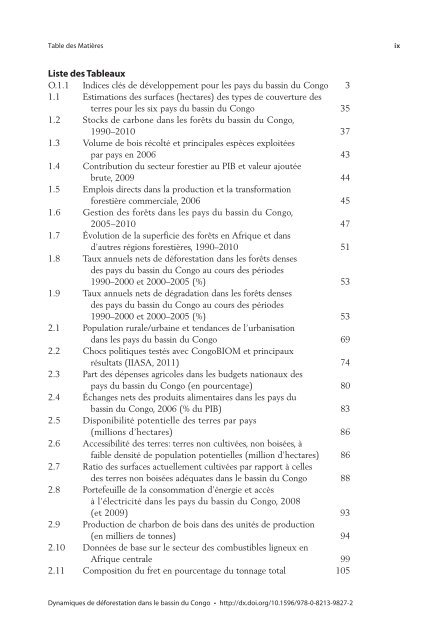
Liste <strong>de</strong>s Tab<strong>le</strong>aux<br />
O.1.1 Indices clés <strong>de</strong> développement pour <strong>le</strong>s pays <strong>du</strong> <strong>bassin</strong> <strong>du</strong> <strong>Congo</strong> 3<br />
1.1 Estimations <strong>de</strong>s surfaces (hectares) <strong>de</strong>s types <strong>de</strong> couverture <strong>de</strong>s<br />
terres pour <strong>le</strong>s six pays <strong>du</strong> <strong>bassin</strong> <strong>du</strong> <strong>Congo</strong> 35<br />
1.2 Stocks <strong>de</strong> carbone <strong>dans</strong> <strong>le</strong>s forêts <strong>du</strong> <strong>bassin</strong> <strong>du</strong> <strong>Congo</strong>,<br />
1990–2010 37<br />
1.3 Volume <strong>de</strong> bois récolté et principa<strong>le</strong>s espèces exploitées<br />
par pays en 2006 43<br />
1.4 Contribution <strong>du</strong> secteur forestier au PIB et va<strong>le</strong>ur ajoutée<br />
brute, 2009 44<br />
1.5 Emplois directs <strong>dans</strong> la pro<strong>du</strong>ction et la transformation<br />
forestière commercia<strong>le</strong>, 2006 45<br />
1.6 Gestion <strong>de</strong>s forêts <strong>dans</strong> <strong>le</strong>s pays <strong>du</strong> <strong>bassin</strong> <strong>du</strong> <strong>Congo</strong>,<br />
2005–2010 47<br />
1.7 Évolution <strong>de</strong> la superficie <strong>de</strong>s forêts en Afrique et <strong>dans</strong><br />
d’autres régions forestières, 1990–2010 51<br />
1.8 Taux annuels nets <strong>de</strong> <strong>déforestation</strong> <strong>dans</strong> <strong>le</strong>s forêts <strong>de</strong>nses<br />
<strong>de</strong>s pays <strong>du</strong> <strong>bassin</strong> <strong>du</strong> <strong>Congo</strong> au cours <strong>de</strong>s pério<strong>de</strong>s<br />
1990–2000 et 2000–2005 (%) 53<br />
1.9 Taux annuels nets <strong>de</strong> dégradation <strong>dans</strong> <strong>le</strong>s forêts <strong>de</strong>nses<br />
<strong>de</strong>s pays <strong>du</strong> <strong>bassin</strong> <strong>du</strong> <strong>Congo</strong> au cours <strong>de</strong>s pério<strong>de</strong>s<br />
1990–2000 et 2000–2005 (%) 53<br />
2.1 Population rura<strong>le</strong>/urbaine et tendances <strong>de</strong> l’urbanisation<br />
<strong>dans</strong> <strong>le</strong>s pays <strong>du</strong> <strong>bassin</strong> <strong>du</strong> <strong>Congo</strong> 69<br />
2.2 Chocs politiques testés avec <strong>Congo</strong>BIOM et principaux<br />
résultats (IIASA, 2011) 74<br />
2.3 Part <strong>de</strong>s dépenses agrico<strong>le</strong>s <strong>dans</strong> <strong>le</strong>s budgets nationaux <strong>de</strong>s<br />
pays <strong>du</strong> <strong>bassin</strong> <strong>du</strong> <strong>Congo</strong> (en pourcentage) 80<br />
2.4 Échanges nets <strong>de</strong>s pro<strong>du</strong>its alimentaires <strong>dans</strong> <strong>le</strong>s pays <strong>du</strong><br />
<strong>bassin</strong> <strong>du</strong> <strong>Congo</strong>, 2006 (% <strong>du</strong> PIB) 83<br />
2.5 Disponibilité potentiel<strong>le</strong> <strong>de</strong>s terres par pays<br />
(millions d’hectares) 86<br />
2.6 Accessibilité <strong>de</strong>s terres: terres non cultivées, non boisées, à<br />
faib<strong>le</strong> <strong>de</strong>nsité <strong>de</strong> population potentiel<strong>le</strong>s (million d’hectares) 86<br />
2.7 Ratio <strong>de</strong>s surfaces actuel<strong>le</strong>ment cultivées par rapport à cel<strong>le</strong>s<br />
<strong>de</strong>s terres non boisées adéquates <strong>dans</strong> <strong>le</strong> <strong>bassin</strong> <strong>du</strong> <strong>Congo</strong> 88<br />
2.8 Portefeuil<strong>le</strong> <strong>de</strong> la consommation d’énergie et accès<br />
à l’é<strong>le</strong>ctricité <strong>dans</strong> <strong>le</strong>s pays <strong>du</strong> <strong>bassin</strong> <strong>du</strong> <strong>Congo</strong>, 2008<br />
(et 2009) 93<br />
2.9 Pro<strong>du</strong>ction <strong>de</strong> charbon <strong>de</strong> bois <strong>dans</strong> <strong>de</strong>s unités <strong>de</strong> pro<strong>du</strong>ction<br />
(en milliers <strong>de</strong> tonnes) 94<br />
2.10 Données <strong>de</strong> base sur <strong>le</strong> secteur <strong>de</strong>s combustib<strong>le</strong>s ligneux en<br />
Afrique centra<strong>le</strong> 99<br />
2.11 Composition <strong>du</strong> fret en pourcentage <strong>du</strong> tonnage total 105<br />
<strong>Dynamiques</strong> <strong>de</strong> <strong>déforestation</strong> <strong>dans</strong> <strong>le</strong> <strong>bassin</strong> <strong>du</strong> <strong>Congo</strong> • http://dx.doi.org/10.1596/978-0-8213-9827-2


