Dynamiques de déforestation dans le bassin du Congo
Dynamiques de déforestation dans le bassin du Congo
Dynamiques de déforestation dans le bassin du Congo

You also want an ePaper? Increase the reach of your titles
YUMPU automatically turns print PDFs into web optimized ePapers that Google loves.
4 Résumé exécutif<br />
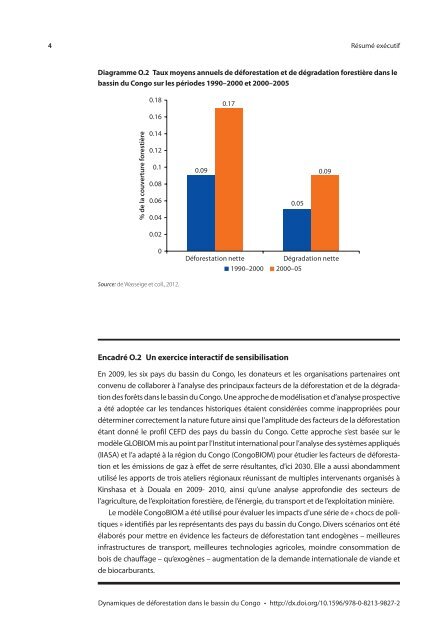
Diagramme O.2 Taux moyens annuels <strong>de</strong> <strong>déforestation</strong> et <strong>de</strong> dégradation forestière <strong>dans</strong> <strong>le</strong><br />
<strong>bassin</strong> <strong>du</strong> <strong>Congo</strong> sur <strong>le</strong>s pério<strong>de</strong>s 1990–2000 et 2000–2005<br />
% <strong>de</strong> la couverture forestière<br />
0.18<br />
0.16<br />
0.14<br />
0.12<br />
0.1<br />
0.08<br />
0.06<br />
0.04<br />
0.02<br />
Source: <strong>de</strong> Wasseige et coll., 2012.<br />
0<br />
0.09<br />
0.17<br />
<strong>Dynamiques</strong> <strong>de</strong> <strong>déforestation</strong> <strong>dans</strong> <strong>le</strong> <strong>bassin</strong> <strong>du</strong> <strong>Congo</strong> • http://dx.doi.org/10.1596/978-0-8213-9827-2<br />
0.05<br />
0.09<br />
Déforestation nette Dégradation nette<br />
1990–2000 2000–05<br />
Encadré O.2 Un exercice interactif <strong>de</strong> sensibilisation<br />
En 2009, <strong>le</strong>s six pays <strong>du</strong> <strong>bassin</strong> <strong>du</strong> <strong>Congo</strong>, <strong>le</strong>s donateurs et <strong>le</strong>s organisations partenaires ont<br />
convenu <strong>de</strong> collaborer à l’analyse <strong>de</strong>s principaux facteurs <strong>de</strong> la <strong>déforestation</strong> et <strong>de</strong> la dégradation<br />
<strong>de</strong>s forêts <strong>dans</strong> <strong>le</strong> <strong>bassin</strong> <strong>du</strong> <strong>Congo</strong>. Une approche <strong>de</strong> modélisation et d’analyse prospective<br />
a été adoptée car <strong>le</strong>s tendances historiques étaient considérées comme inappropriées pour<br />
déterminer correctement la nature future ainsi que l’amplitu<strong>de</strong> <strong>de</strong>s facteurs <strong>de</strong> la <strong>déforestation</strong><br />
étant donné <strong>le</strong> profil CEFD <strong>de</strong>s pays <strong>du</strong> <strong>bassin</strong> <strong>du</strong> <strong>Congo</strong>. Cette approche s’est basée sur <strong>le</strong><br />
modè<strong>le</strong> GLOBIOM mis au point par l’Institut international pour l’analyse <strong>de</strong>s systèmes appliqués<br />
(IIASA) et l’a adapté à la région <strong>du</strong> <strong>Congo</strong> (<strong>Congo</strong>BIOM) pour étudier <strong>le</strong>s facteurs <strong>de</strong> <strong>déforestation</strong><br />
et <strong>le</strong>s émissions <strong>de</strong> gaz à effet <strong>de</strong> serre résultantes, d’ici 2030. El<strong>le</strong> a aussi abondamment<br />
utilisé <strong>le</strong>s apports <strong>de</strong> trois ateliers régionaux réunissant <strong>de</strong> multip<strong>le</strong>s intervenants organisés à<br />
Kinshasa et à Douala en 2009- 2010, ainsi qu’une analyse approfondie <strong>de</strong>s secteurs <strong>de</strong><br />
l’agriculture, <strong>de</strong> l’exploitation forestière, <strong>de</strong> l’énergie, <strong>du</strong> transport et <strong>de</strong> l’exploitation minière.<br />
Le modè<strong>le</strong> <strong>Congo</strong>BIOM a été utilisé pour évaluer <strong>le</strong>s impacts d’une série <strong>de</strong> « chocs <strong>de</strong> politiques<br />
» i<strong>de</strong>ntifiés par <strong>le</strong>s représentants <strong>de</strong>s pays <strong>du</strong> <strong>bassin</strong> <strong>du</strong> <strong>Congo</strong>. Divers scénarios ont été<br />
élaborés pour mettre en évi<strong>de</strong>nce <strong>le</strong>s facteurs <strong>de</strong> <strong>déforestation</strong> tant endogènes – meil<strong>le</strong>ures<br />
infrastructures <strong>de</strong> transport, meil<strong>le</strong>ures technologies agrico<strong>le</strong>s, moindre consommation <strong>de</strong><br />
bois <strong>de</strong> chauffage – qu’exogènes – augmentation <strong>de</strong> la <strong>de</strong>man<strong>de</strong> internationa<strong>le</strong> <strong>de</strong> vian<strong>de</strong> et<br />
<strong>de</strong> biocarburants.