1uozJuX
1uozJuX
1uozJuX

Create successful ePaper yourself
Turn your PDF publications into a flip-book with our unique Google optimized e-Paper software.
DIAGNOSTIC DU SECTEUR éNERGIE - Septembre 2012<br />
Ce tableau donne une indication de la potentialité des régions en termes de surface. Il est important de considérer<br />
d’autres facteurs qui influent sur la faisabilité d’une culture à vocation énergétique donnée tels que la qualité du sol, le<br />
climat ainsi que les autres conditions de durabilité des projets agrocarburants notamment l’aspect foncier et social.<br />
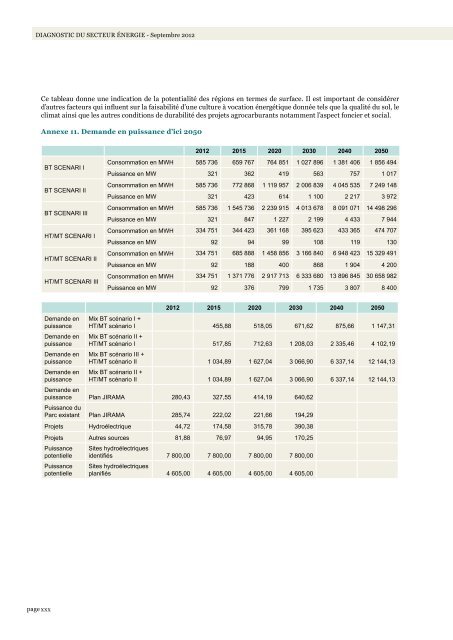
Annexe 11. Demande en puissance d’ici 2050<br />
2012 2015 2020 2030 2040 2050<br />
BT SCENARI I<br />
BT SCENARI II<br />
BT SCENARI III<br />
HT/MT SCENARI I<br />
HT/MT SCENARI II<br />
HT/MT SCENARI III<br />
Consommation en MWH 585 736 659 767 764 851 1 027 896 1 381 406 1 856 494<br />
Puissance en MW 321 362 419 563 757 1 017<br />
Consommation en MWH 585 736 772 868 1 119 957 2 006 839 4 045 535 7 249 148<br />
Puissance en MW 321 423 614 1 100 2 217 3 972<br />
Consommation en MWH 585 736 1 545 736 2 239 915 4 013 678 8 091 071 14 498 296<br />
Puissance en MW 321 847 1 227 2 199 4 433 7 944<br />
Consommation en MWH 334 751 344 423 361 168 395 623 433 365 474 707<br />
Puissance en MW 92 94 99 108 119 130<br />
Consommation en MWH 334 751 685 888 1 458 856 3 166 840 6 948 423 15 329 491<br />
Puissance en MW 92 188 400 868 1 904 4 200<br />
Consommation en MWH 334 751 1 371 776 2 917 713 6 333 680 13 896 845 30 658 982<br />
Puissance en MW 92 376 799 1 735 3 807 8 400<br />
Demande en<br />
puissance<br />
Demande en<br />
puissance<br />
Demande en<br />
puissance<br />
Demande en<br />
puissance<br />
2012 2015 2020 2030 2040 2050<br />
Mix BT scénario I +<br />
HT/MT scénario I 455,88 518,05 671,62 875,66 1 147,31<br />
Mix BT scénario II +<br />
HT/MT scénario I 517,85 712,63 1 208,03 2 335,46 4 102,19<br />
Mix BT scénario III +<br />
HT/MT scénario II 1 034,89 1 627,04 3 066,90 6 337,14 12 144,13<br />
Mix BT scénario II +<br />
HT/MT scénario II 1 034,89 1 627,04 3 066,90 6 337,14 12 144,13<br />
Demande en<br />
puissance Plan JIRAMA 280,43 327,55 414,19 640,62<br />
Puissance du<br />
Parc existant Plan JIRAMA 285,74 222,02 221,66 194,29<br />
Projets Hydroélectrique 44,72 174,58 315,78 390,38<br />
Projets Autres sources 81,88 76,97 94,95 170,25<br />
Puissance<br />
potentielle<br />
Puissance<br />
potentielle<br />
Sites hydroélectriques<br />
identifiés 7 800,00 7 800,00 7 800,00 7 800,00<br />
Sites hydroélectriques<br />
planifiés 4 605,00 4 605,00 4 605,00 4 605,00<br />
page xxx<br />
page xxxi