Rapport Diagnostic - Project destinations
Rapport Diagnostic - Project destinations
Rapport Diagnostic - Project destinations

Create successful ePaper yourself
Turn your PDF publications into a flip-book with our unique Google optimized e-Paper software.
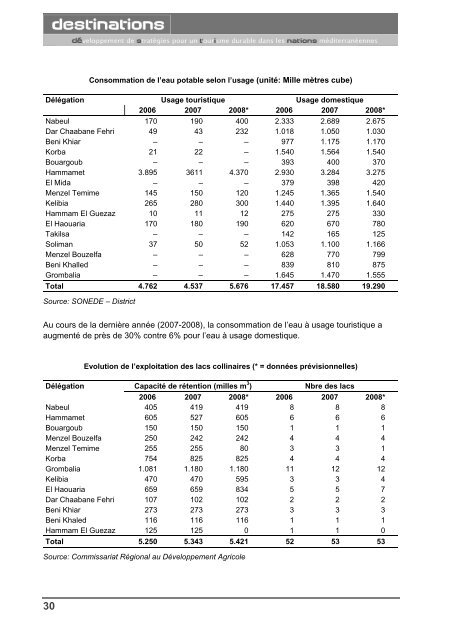
Consommation de l’eau potable selon l’usage (unité: Mille mètres cube)Délégation Usage touristique Usage domestique2006 2007 2008* 2006 2007 2008*Nabeul 170 190 400 2.333 2.689 2.675Dar Chaabane Fehri 49 43 232 1.018 1.050 1.030Beni Khiar – – – 977 1.175 1.170Korba 21 22 – 1.540 1.564 1.540Bouargoub – – – 393 400 370Hammamet 3.895 3611 4.370 2.930 3.284 3.275El Mida – – – 379 398 420Menzel Temime 145 150 120 1.245 1.365 1.540Kelibia 265 280 300 1.440 1.395 1.640Hammam El Guezaz 10 11 12 275 275 330El Haouaria 170 180 190 620 670 780Takilsa – – – 142 165 125Soliman 37 50 52 1.053 1.100 1.166Menzel Bouzelfa – – – 628 770 799Beni Khalled – – – 839 810 875Grombalia – – – 1.645 1.470 1.555Total 4.762 4.537 5.676 17.457 18.580 19.290Source: SONEDE – DistrictAu cours de la dernière année (2007-2008), la consommation de l’eau à usage touristique aaugmenté de près de 30% contre 6% pour l’eau à usage domestique.Evolution de l’exploitation des lacs collinaires (* = données prévisionnelles)DélégationCapacité de rétention (milles m 3 )Nbre des lacs2006 2007 2008* 2006 2007 2008*Nabeul 405 419 419 8 8 8Hammamet 605 527 605 6 6 6Bouargoub 150 150 150 1 1 1Menzel Bouzelfa 250 242 242 4 4 4Menzel Temime 255 255 80 3 3 1Korba 754 825 825 4 4 4Grombalia 1.081 1.180 1.180 11 12 12Kelibia 470 470 595 3 3 4El Haouaria 659 659 834 5 5 7Dar Chaabane Fehri 107 102 102 2 2 2Beni Khiar 273 273 273 3 3 3Beni Khaled 116 116 116 1 1 1Hammam El Guezaz 125 125 0 1 1 0Total 5.250 5.343 5.421 52 53 53Source: Commissariat Régional au Développement Agricole30