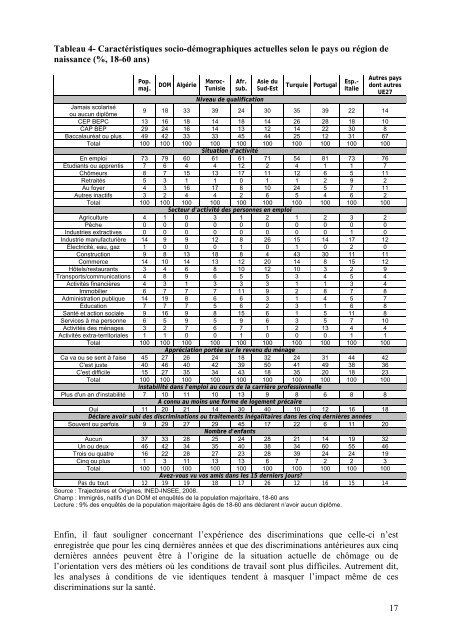
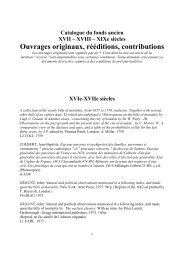
1.5. Diversité <strong>de</strong>s conditions <strong>de</strong> vie selon l’origine <strong>et</strong> diversité <strong>de</strong>s causes d’altération<strong>de</strong> <strong>la</strong> <strong>santé</strong>Si les biais <strong>de</strong> déc<strong>la</strong>ration liés à l’approche culturelle <strong>de</strong>s enquêtés vis-à-vis <strong>de</strong> <strong>la</strong> <strong>santé</strong> nedoivent être négligés, il faut rappeler que les caractéristiques <strong>de</strong> conditions <strong>de</strong> vie pouvantconstituer <strong>de</strong>s expériences néfastes pour <strong>la</strong> <strong>santé</strong> ne concernent pas, <strong>de</strong> manière équivalente,les différentes origines, <strong>de</strong> même qu’il convient d’aller plus loin dans l’examen <strong>de</strong>sdifférences <strong>de</strong> conditions <strong>de</strong> vie. Dit autrement, certains groupes <strong>de</strong> popu<strong>la</strong>tion se concentrentdavantage dans les milieux défavorisés. C’est ce que décrit le Tableau 4 ci-<strong>de</strong>ssous enprésentant les caractéristiques socio-démographiques actuelles selon l’origine <strong>de</strong>s enquêtés,en présentant à <strong>la</strong> fois <strong>de</strong>s variables utilisées dans le modèle présenté précé<strong>de</strong>mment <strong>et</strong>d’autres qui n’ont pu être insérées. De même, le fait d’avoir vécu une situation difficilependant l’enfance recouvre <strong>de</strong>s réalités re<strong>la</strong>tivement différentes selon les origines, comme onpeut le voir dans le Tableau 5.Les immigrés venus <strong>de</strong> Turquie concentrent à <strong>la</strong> fois un taux élevé <strong>de</strong> personnes nondiplômées(35% contre 9% parmi <strong>la</strong> popu<strong>la</strong>tion majoritaire), au chômage ou confrontées àd’importantes difficultés financières. Il en est <strong>de</strong> même <strong>de</strong>s originaires du Maghreb qui sont<strong>de</strong> surcroît plus nombreux à déc<strong>la</strong>rer <strong>de</strong>s discriminations (28% contre 9% pour <strong>la</strong> popu<strong>la</strong>tionmajoritaire). Si les immigrés portugais ne sont pas davantage diplômés que ceux <strong>de</strong> Turquie,ils se distinguent par un taux <strong>de</strong> chômage inférieur à celui <strong>de</strong> <strong>la</strong> popu<strong>la</strong>tion majoritaire, maisaussi par un taux plus élevé <strong>de</strong> personnes déc<strong>la</strong>rant avoir vécus <strong>de</strong>s situations difficilespendant l’enfance (44% contre 26%), plus souvent liées à <strong>de</strong>s problèmes d’alcool <strong>de</strong>s parentsque dans les autres groupes.Les immigrés en emploi, originaires <strong>de</strong> Turquie comme du Portugal, se concentrent, chez leshommes, dans <strong>de</strong>s secteurs d’activité tels que les métiers du bâtiment (respectivement 57% <strong>et</strong>51%) <strong>et</strong> chez les femmes, dans les activités d’ai<strong>de</strong> à <strong>la</strong> personne (28% <strong>de</strong>s immigréesportugaises) ou <strong>de</strong> métiers dans <strong>la</strong> restauration (18% <strong>de</strong>s femmes immigrées turques), <strong>de</strong>semplois pénibles aux eff<strong>et</strong>s probablement délétères pour <strong>la</strong> <strong>santé</strong>. Notons qu’une femmeimmigrée <strong>de</strong> Turquie sur <strong>de</strong>ux est au foyer (un taux 6 fois plus élevé que dans <strong>la</strong> popu<strong>la</strong>tionmajoritaire <strong>et</strong> n<strong>et</strong>tement supérieur à ceux observés dans les autres groupes). Si les originairesd’Asie du Sud-Est sont également plus nombreux que les personnes <strong>de</strong> <strong>la</strong> popu<strong>la</strong>tionmajoritaire à n’avoir aucun diplôme (30%), ils ne sont pas davantage confrontés au chômageou aux difficultés financières. En revanche, ils ont été trois fois plus souvent confrontés à <strong>de</strong>ssituations très précaires <strong>de</strong> logement (45%), ce qui résulte notamment du parcours <strong>de</strong> réfugiéspolitiques <strong>de</strong> beaucoup d’entre eux <strong>et</strong> du parcours migratoire <strong>de</strong>s boat people. Les nondiplôméssont <strong>de</strong>ux fois plus nombreux chez les natifs d’un DOM (19%) que dans <strong>la</strong>popu<strong>la</strong>tion majoritaire, mais ils ne sont pas, eux-non plus, davantage au chômage ou endifficulté financière. Ils sont nombreux à avoir connu <strong>de</strong>s situations difficiles pendantl’enfance (37% contre 25% pour <strong>la</strong> popu<strong>la</strong>tion majoritaire) <strong>et</strong> à déc<strong>la</strong>rer <strong>de</strong>s discriminations(29%). Quant aux immigrés d’Afrique subsaharienne, ils sont en bonne <strong>santé</strong> du fait <strong>de</strong> leurjeune âge <strong>et</strong> <strong>de</strong> leurs qualifications plus élevées, constat particulièrement vrai pour leshommes (58% ont un niveau bacca<strong>la</strong>uréat ou supérieur contre 46% dans <strong>la</strong> popu<strong>la</strong>tionmajoritaire) <strong>et</strong> dans une moindre mesure pour les femmes (36% contre 52%), mais ilscumulent déjà tous les autres facteurs néfastes pour <strong>la</strong> <strong>santé</strong>, ce qui <strong>la</strong>isse augurer que dansquelques années, leur <strong>santé</strong> se dégra<strong>de</strong>ra rapi<strong>de</strong>ment, d’autant qu’une proportion importanted’entre eux a aussi le statut <strong>de</strong> réfugié.16
Tableau 4- Caractéristiques socio-démographiques actuelles selon le pays ou région <strong>de</strong>naissance (%, 18-60 ans)Pop.maj.DOM AlgérieMaroc-TunisieAfr.sub.Asie duSud-EstTurquie PortugalEsp.-ItalieAutres paysdont autresUE27Niveau <strong>de</strong> qualificationJamais sco<strong>la</strong>riséou aucun diplôme9 18 33 39 24 30 35 39 22 14CEP BEPC 13 16 18 14 18 14 26 28 18 <strong>10</strong>CAP BEP 29 24 16 14 13 12 14 22 30 8Bacca<strong>la</strong>uréat ou plus 49 42 33 33 45 44 25 12 31 67Total <strong>10</strong>0 <strong>10</strong>0 <strong>10</strong>0 <strong>10</strong>0 <strong>10</strong>0 <strong>10</strong>0 <strong>10</strong>0 <strong>10</strong>0 <strong>10</strong>0 <strong>10</strong>0Situation d'activitéEn emploi 73 79 60 61 61 71 54 81 73 76Etudiants ou apprentis 7 6 4 4 12 2 4 1 1 7Chômeurs 8 7 15 13 17 11 12 6 5 11R<strong>et</strong>raités 5 3 1 1 0 1 1 2 9 2Au foyer 4 3 16 17 8 <strong>10</strong> 24 5 7 11Autres inactifs 3 2 4 4 2 6 5 4 6 2Total <strong>10</strong>0 <strong>10</strong>0 <strong>10</strong>0 <strong>10</strong>0 <strong>10</strong>0 <strong>10</strong>0 <strong>10</strong>0 <strong>10</strong>0 <strong>10</strong>0 <strong>10</strong>0Secteur d'activité <strong>de</strong>s personnes en emploiAgriculture 4 1 0 3 1 2 1 2 3 2Pêche 0 0 0 0 0 0 0 0 0 0Industries extractives 0 0 0 0 0 0 0 0 1 0Industrie manufacturière 14 9 9 12 8 26 15 14 17 12Électricité, eau, gaz 1 0 0 0 1 0 1 0 2 0Construction 9 8 13 18 8 4 43 30 11 11Commerce 14 <strong>10</strong> 14 13 12 20 14 8 15 12Hôtels/restaurants 3 4 6 8 <strong>10</strong> 12 <strong>10</strong> 3 2 9Transports/communications 4 8 9 6 5 5 3 4 5 4Activités financières 4 3 1 3 3 3 1 1 3 4Immobilier 6 7 7 7 11 9 2 8 7 8Administration publique 14 19 8 6 6 3 1 4 5 7Éducation 7 7 7 5 6 2 3 1 6 8Santé <strong>et</strong> action sociale 9 16 9 8 15 6 1 5 11 8Services à ma personne 6 5 9 5 9 6 3 5 7 <strong>10</strong>Activités <strong>de</strong>s ménages 3 2 7 6 7 1 2 13 4 4Activités extra-territoriales 1 1 0 0 1 0 0 0 1 1Total <strong>10</strong>0 <strong>10</strong>0 <strong>10</strong>0 <strong>10</strong>0 <strong>10</strong>0 <strong>10</strong>0 <strong>10</strong>0 <strong>10</strong>0 <strong>10</strong>0 <strong>10</strong>0Appréciation portée sur le revenu du ménageCa va ou se sent à l'aise 45 27 26 24 18 32 24 31 44 42C'est juste 40 46 40 42 39 50 41 49 38 36C'est difficile 15 27 35 34 43 18 35 20 18 23Total <strong>10</strong>0 <strong>10</strong>0 <strong>10</strong>0 <strong>10</strong>0 <strong>10</strong>0 <strong>10</strong>0 <strong>10</strong>0 <strong>10</strong>0 <strong>10</strong>0 <strong>10</strong>0Instabilité dans l'emploi au cours <strong>de</strong> <strong>la</strong> carrière professionnellePlus d'un an d'instabilité 7 <strong>10</strong> 11 <strong>10</strong> 13 9 8 6 8 8A connu au moins une forme <strong>de</strong> logement précaireOui 11 20 21 14 30 40 <strong>10</strong> 12 16 18Déc<strong>la</strong>re avoir subi <strong>de</strong>s discriminations ou traitements inégalitaires dans les cinq <strong>de</strong>rnières annéesSouvent ou parfois 9 29 27 29 45 17 22 6 11 20Nombre d'enfantsAucun 37 33 28 25 24 28 21 14 19 32Un ou <strong>de</strong>ux 46 42 34 35 40 38 34 60 55 46Trois ou quatre 16 22 28 27 23 28 39 24 24 19Cinq ou plus 1 3 11 13 13 6 7 2 2 3Total <strong>10</strong>0 <strong>10</strong>0 <strong>10</strong>0 <strong>10</strong>0 <strong>10</strong>0 <strong>10</strong>0 <strong>10</strong>0 <strong>10</strong>0 <strong>10</strong>0 <strong>10</strong>0Avez-vous vu vos amis dans les 15 <strong>de</strong>rniers jours?Pas du tout 12 19 19 18 17 26 12 16 15 14Source : Trajectoires <strong>et</strong> Origines, INED-INSEE, 2008.Champ : Immigrés, natifs d’un DOM <strong>et</strong> enquêtés <strong>de</strong> <strong>la</strong> popu<strong>la</strong>tion majoritaire, 18-60 ansLecture : 9% <strong>de</strong>s enquêtés <strong>de</strong> <strong>la</strong> popu<strong>la</strong>tion majoritaire âgés <strong>de</strong> 18-60 ans déc<strong>la</strong>rent n’avoir aucun diplôme.Enfin, il faut souligner concernant l’expérience <strong>de</strong>s discriminations que celle-ci n’estenregistrée que pour les cinq <strong>de</strong>rnières années <strong>et</strong> que <strong>de</strong>s discriminations antérieures aux cinq<strong>de</strong>rnières années peuvent être à l’origine <strong>de</strong> <strong>la</strong> situation actuelle <strong>de</strong> chômage ou <strong>de</strong>l’orientation vers <strong>de</strong>s métiers où les conditions <strong>de</strong> travail sont plus difficiles. Autrement dit,les analyses à conditions <strong>de</strong> vie i<strong>de</strong>ntiques ten<strong>de</strong>nt à masquer l’impact même <strong>de</strong> cesdiscriminations sur <strong>la</strong> <strong>santé</strong>.17