Buletin Geospatial Sektor Awam - Bil 1/ 2007 - Malaysia Geoportal
Buletin Geospatial Sektor Awam - Bil 1/ 2007 - Malaysia Geoportal
Buletin Geospatial Sektor Awam - Bil 1/ 2007 - Malaysia Geoportal
- No tags were found...

Create successful ePaper yourself
Turn your PDF publications into a flip-book with our unique Google optimized e-Paper software.
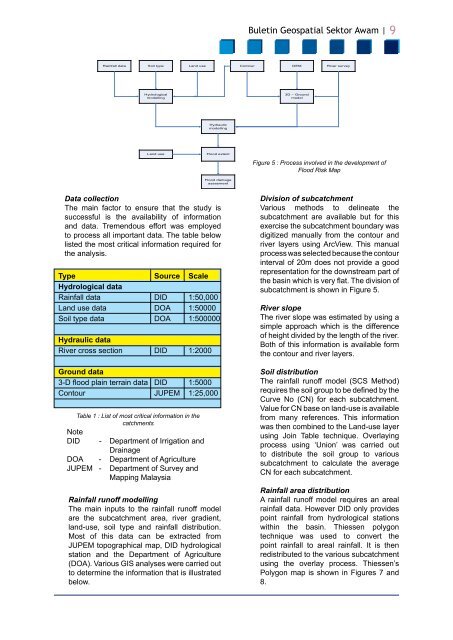
<strong>Buletin</strong> <strong>Geospatial</strong> <strong>Sektor</strong> <strong>Awam</strong> |9Rainfall dataSoil type Land useContour DEMRiver surveyHydrologicalmodelling3D – GroundmodelHydraulicmodellingLand useFlood extentFigure 5 : Process involved in the development ofFlood Risk MapFlood damageassesmentData collectionThe main factor to ensure that the study issuccessful is the availability of informationand data. Tremendous effort was employedto process all important data. The table belowlisted the most critical information required forthe analysis.Type Source ScaleHydrological dataRainfall data DID 1:50,000Land use data DOA 1:50000Soil type data DOA 1:500000Hydraulic dataRiver cross section DID 1:2000Ground data3-D flood plain terrain data DID 1:5000Contour JUPEM 1:25,000Table 1 : List of most critical information in thecatchmentsNoteDID - Department of Irrigation andDrainageDOA - Department of AgricultureJUPEM - Department of Survey andMapping <strong>Malaysia</strong>Rainfall runoff modellingThe main inputs to the rainfall runoff modelare the subcatchment area, river gradient,land-use, soil type and rainfall distribution.Most of this data can be extracted fromJUPEM topographical map, DID hydrologicalstation and the Department of Agriculture(DOA). Various GIS analyses were carried outto determine the information that is illustratedbelow.Division of subcatchmentVarious methods to delineate thesubcatchment are available but for thisexercise the subcatchment boundary wasdigitized manually from the contour andriver layers using ArcView. This manualprocess was selected because the contourinterval of 20m does not provide a goodrepresentation for the downstream part ofthe basin which is very flat. The division ofsubcatchment is shown in Figure 5.River slopeThe river slope was estimated by using asimple approach which is the differenceof height divided by the length of the river.Both of this information is available formthe contour and river layers.Soil distributionThe rainfall runoff model (SCS Method)requires the soil group to be defined by theCurve No (CN) for each subcatchment.Value for CN base on land-use is availablefrom many references. This informationwas then combined to the Land-use layerusing Join Table technique. Overlayingprocess using ‘Union’ was carried outto distribute the soil group to varioussubcatchment to calculate the averageCN for each subcatchment.Rainfall area distributionA rainfall runoff model requires an arealrainfall data. However DID only providespoint rainfall from hydrological stationswithin the basin. Thiessen polygontechnique was used to convert thepoint rainfall to areal rainfall. It is thenredistributed to the various subcatchmentusing the overlay process. Thiessen’sPolygon map is shown in Figures 7 and8.