- Page 1 and 2: EXAMINING PATTERNS OF ITALIAN IMMIG
- Page 3 and 4: Introduction Italians, as well as i
- Page 5 and 6: The Immigration History Research Ce
- Page 7 and 8: immigrated to North America. Northe
- Page 9 and 10: equaled that of men during the 1930
- Page 11 and 12: chose the same agents, but instruct
- Page 13 and 14: economic crisis both in Southern an
- Page 15 and 16: cultural, because of fear of the lo
- Page 17 and 18: in a fire. The census of 1870 is th
- Page 19 and 20: 2.2 Italians in Houghton County in
- Page 21 and 22: Again there was information about t
- Page 23 and 24: Emilia Romagna Parma 3 3 (0.06%) La
- Page 25 and 26: as in 1910 by Bergamo with thirty-n
- Page 27 and 28: nineteen (0.7%) and eighteen (0.7%)
- Page 29 and 30: Figure IV. Map of the Province of L
- Page 31 and 32: Figure VI. Map of Italy showing bor
- Page 33 and 34: Valle D’Aosta 1. Aosta Piemonte (
- Page 35 and 36: database. On some of them, in fact,
- Page 37 and 38: It would have been interesting to d
- Page 39 and 40: 3.0 Goals and Methods Chapter III -
- Page 41 and 42: It is not possible to establish a s
- Page 43 and 44: FARMING 2 Laborer/farm 2 (0.11%) FO
- Page 45 and 46: jobs that do not require a great de
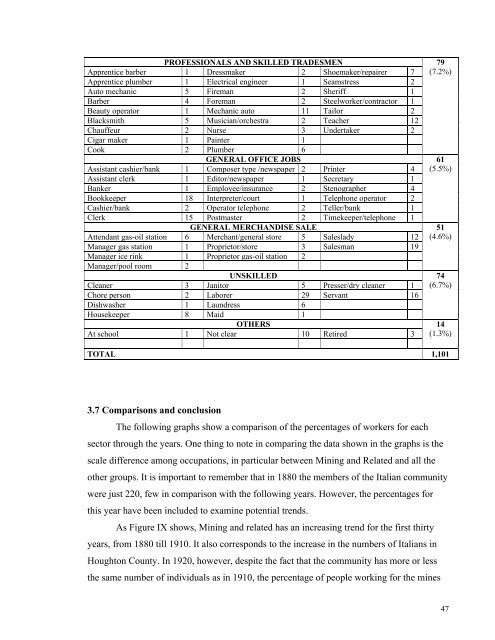
- Page 47 and 48: As in 1900, there seems to be no re
- Page 49 and 50: BOARDING 11 Keeper/boarding h. 5 La
- Page 51: TABLE XIV. OCCUPATIONS IN 1930 Assi
- Page 55 and 56: Taking into consideration that 1880
- Page 57 and 58: Percent Unskilled (Figure XVIII), a
- Page 59 and 60: 4.0 Goals and Methods Chapter IV -
- Page 61 and 62: As for distribution of Torinesi and
- Page 63 and 64: Lucchesi, on the other hand, settle
- Page 65 and 66: PORTAGE Houghton 18 Hurontown 67 QU
- Page 67 and 68: Seventy-nine Italians are living in
- Page 69 and 70: The decrease in the number of Itali
- Page 71 and 72: egions’ Italians as being from th
- Page 73 and 74: Liguria, Veneto, and Emilia-Romagna
- Page 75 and 76: 10, 1908. It became the meeting pla
- Page 77 and 78: Ettore Perrone Society among the Re
- Page 79 and 80: Citizens’ League No. 3 (Lega Citt
- Page 81 and 82: were volunteer followers of Giusepp
- Page 83 and 84: Figure XXVIII. Front page of the by
- Page 85 and 86: Figure XXXII. Section of Il Minator
- Page 87 and 88: more news from the world. Page thre
- Page 89 and 90: Almost nothing is known about La De
- Page 91 and 92: Chapter VI - Conclusions The main g
- Page 93 and 94: mining companies, Calumet & Hecla,
- Page 95 and 96: BOOKS AND ARTICLES AA.VV. Ricordo a
- Page 97 and 98: Foerster, Robert F. The Italian Emi
- Page 99 and 100: Rozzonelli, C. The Italian Immigrat
- Page 101 and 102: The Daily Mining Gazette. Houghton,
- Page 103 and 104:
APPENDIXES 98
- Page 105 and 106:
100
- Page 107 and 108:
Constitution Art. 1 - This union am
- Page 109 and 110:
Rights and obligations of the socie
- Page 111 and 112:
Obligations of the Great Marshall.
- Page 113 and 114:
Constitution And Paycheck Book of t
- Page 115 and 116:
Art. 2 Principal aim of the federat
- Page 117 and 118:
Art. 9 Special conventions can be h
- Page 119 and 120:
Art. 17 If a member move to a place
- Page 121 and 122:
Art. 26 The Deputies of the federat
- Page 123 and 124:
Miners’ Bulletin N. 54 01-28-1914
- Page 125 and 126:
Miners’ Bulletin N. 57 02-18-1914
- Page 127 and 128:
Altopascio Bagni di Lucca Barga Bor
- Page 129 and 130:
MAIN VILLAGES OF THE CANAVESE FROM
- Page 131 and 132:
DW FA SURNAME NAME AGE SEX PROFESSI
- Page 133 and 134:
D DW FA SURNAME NAME REL SEX AGE OC
- Page 135 and 136:
126 101 149 BANDONI DAVID B M 28 LA
- Page 137 and 138:
APPENDIX VIII CENSUS of 1900 LEGEND
- Page 139 and 140:
61 NARETTO ANTONE B 40 S ITALY ITAL
- Page 141 and 142:
187 SUCCA DOMINICK B 35 M3 ITALY IT
- Page 143 and 144:
313 1604 GIULIO MARY W 31 M9 ITALY
- Page 145 and 146:
439 1318 BOGGIO JOHN H 36 M? ITALY
- Page 147 and 148:
565 MASCAGNO MIKE S 1 S MICHIGAN IT
- Page 149 and 150:
691 PECHIETTO JOSEPH B 19 S ITALY I
- Page 151 and 152:
817 2505 FAUSONE MARY W 44 M29 ITAL
- Page 153 and 154:
943 2457 MACARIO JOHN S 12 S ITALY
- Page 155 and 156:
1069 2021 PUCCI ANGO B 38 S ITALY I
- Page 157 and 158:
1195 4045 BOBBIO PAUL H 40 M10 ITAL
- Page 159 and 160:
1321 4232 MELIA/MELIS MARY D 3 S MI
- Page 161 and 162:
1447 RICCI JOSEPHINA W 32 M3 ITALY
- Page 163 and 164:
1573 114 NOTARIO JOSEPH PART 32 S I
- Page 165 and 166:
1699 313 GALLASERO CHARLES H 39 M17
- Page 167 and 168:
1825 TERESA ALBERT S 7 S ITALY ITAL
- Page 169 and 170:
1951 340 SUINO DOMINICK H 38 M8 ITA
- Page 171 and 172:
2077 442 CURTO ANNA D 2 S MICHIGAN
- Page 173 and 174:
2203 MONTICELLI GUIDO S 2 S MICHIGA
- Page 175 and 176:
2329 VENTURELLI ? B 23 S ITALY ITAL
- Page 177 and 178:
2455 BALCONI MARY W 37 M21 ITALY IT
- Page 179 and 180:
2581 GIUSFREDI GABRIELLO B 26 S ITA
- Page 181 and 182:
2707 200? AIMONE KATE D 4 S ILLINOI
- Page 183 and 184:
APPENDIX IX CENSUS of 1910 LEGEND I
- Page 185 and 186:
63 503 CHIADO LUIGI H 28 ITALY ITAL
- Page 187 and 188:
189 206 MIGLIO/MIGLIA VITTORIA D 8
- Page 189 and 190:
315 VOLPI JOHNNIE S 14 MICHIGAN ITA
- Page 191 and 192:
441 408 DEL GHINGARO GIOVANNI B 45
- Page 193 and 194:
567 NN DOMIDO AMANTO B 32 ITALY ITA
- Page 195 and 196:
693 RENALDI GIUSEPPE S 3 MICHIGAN I
- Page 197 and 198:
819 509 MIGLIO/MIGLIA TERESA D 14 M
- Page 199 and 200:
945 318 MIGLIO/MIGLIA CARLO S 4 SOU
- Page 201 and 202:
1071 211 RASTELLO GIOVANNI H 42 ITA
- Page 203 and 204:
1197 109 TORREANO AGOSTINO S 35 MIC
- Page 205 and 206:
1323 109 CENTANINO ANTONIO B 21 ITA
- Page 207 and 208:
1449 211 BRONZO GIUSEPPE S 16 MICHI
- Page 209 and 210:
1575 341 GRISOLANO JOHN S 16 MICHIG
- Page 211 and 212:
1701 DE FILIPPI JOSEPH S 20 MICHIGA
- Page 213 and 214:
1827 1507 SILVA MARGHERITA W 23 ITA
- Page 215 and 216:
1953 1546 BARATONO JOHN H 42 ITALY
- Page 217 and 218:
2079 2029 OSTORERO PETER B 32 ITALY
- Page 219 and 220:
2205 2523 SALAME ANNUNZIATA MO 56 I
- Page 221 and 222:
2331 2451 MACARIO JOSEPH S 13 MICHI
- Page 223 and 224:
2457 3573 LOSCETTO LOUISE W 25 ITAL
- Page 225 and 226:
2583 4087 POGGIONE MARY D 16 MICHIG
- Page 227 and 228:
2709 GROSSO DOMENICO S 10 ITALY ITA
- Page 229 and 230:
2835 3949 BUCHER MARIA D 10 ITALY I
- Page 231 and 232:
2961 25 RIASI? TONIO B 31 ITALY ITA
- Page 233 and 234:
3087 35 ROLANDO PAOLO H 55 ITALY IT
- Page 235 and 236:
3213 6 ROCCHI CAROLINA D 6 MICHIGAN
- Page 237 and 238:
3339 GALLI LUIGI B 18 ITALY ITALY I
- Page 239 and 240:
3465 MEALLIA ANTONIO B 39 ITALY ITA
- Page 241 and 242:
3591 DE FILIPPI DOMENICO H 36 ITALY
- Page 243 and 244:
3717 9 CAVALZANI MARIA W 28 ITALY I
- Page 245 and 246:
3843 410 PERA MARY W 22 MICHIGAN IT
- Page 247 and 248:
3969 1014 PIERONI JOHN H 37 ITALY I
- Page 249 and 250:
4095 187 COMINA EPIFANIO B 18 ITALY
- Page 251 and 252:
4221 166 SCUSSEL MICHELE S 2 MICHIG
- Page 253 and 254:
4347 RIFFALO JOSEPH H 23 ITALY ITAL
- Page 255 and 256:
ID N SURNAME NAME REL AGE BORN FATH
- Page 257 and 258:
126 208 ANDREINI PAUL S 10 MICHIGAN
- Page 259 and 260:
252 GUIDOTTI LAILA D 6 MICHIGAN ITA
- Page 261 and 262:
378 SANTOSI TERESA W 48 ITALY ITALY
- Page 263 and 264:
504 PIEROTTI ORLANDO H 40 ITALY ITA
- Page 265 and 266:
630 206 CANI PAUL H 29 ITALY ITALY
- Page 267 and 268:
756 BARTOLOMEI CANDIDO B UN ITALY I
- Page 269 and 270:
882 GAGGINI GILDA D 6 MICHIGAN ITAL
- Page 271 and 272:
1008 PAOLI ATTILIO B 21 ITALY ITALY
- Page 273 and 274:
1134 TEPATTI ANGELA W 57 ITALY ITAL
- Page 275 and 276:
1260 MUSSATO DOMENICA W 34 ITALY IT
- Page 277 and 278:
1386 VALLERO LUISA D 10 MICHIGAN IT
- Page 279 and 280:
1512 MENEGUZZO JOSEPH S 3 MICHIGAN
- Page 281 and 282:
1638 ZOZO ANNA W 20 MICHIGAN ITALY
- Page 283 and 284:
1764 BRACCO ANTONIO S 24 MICHIGAN I
- Page 285 and 286:
1890 4011 BIGANDO JOHN H 34 ITALY I
- Page 287 and 288:
2016 MICHELINI ESTER W 42 ITALY ITA
- Page 289 and 290:
2142 3950 DATA/DATTA JOHN H 45 ITAL
- Page 291 and 292:
2268 PICCHIOTTINO HENRIETTE D 19 MI
- Page 293 and 294:
2394 GALLINATTI BATTISTA S 16 ITALY
- Page 295 and 296:
2520 80 GALLASERO JAMES H 45 ITALY
- Page 297 and 298:
2646 323 MARTA KATE H 56 ITALY ITAL
- Page 299 and 300:
2772 SAPINO ANNE W 21 ITALY ITALY I
- Page 301 and 302:
2898 208 NIGRA KATE SER 23 MICHIGAN
- Page 303 and 304:
3024 812 BORGO MIKE H 76 ITALY ITAL
- Page 305 and 306:
3150 LOCATELLI ISOLINA D 3 MICHIGAN
- Page 307 and 308:
3276 PATERNI LOUISA D 14 MICHIGAN I
- Page 309 and 310:
3402 CORTOPASSI MARIO S 1 MICHIGAN
- Page 311 and 312:
3528 BURLO BERNARD B 26 ITALY ITALY
- Page 313 and 314:
3654 AGRETTI VITTORIA D 18 ITALY IT
- Page 315 and 316:
3780 REVELLO ARTURO S 12 MICHIGAN I
- Page 317 and 318:
3906 RENALDI GENEVIEVE D 9 MICHIGAN
- Page 319 and 320:
4032 COLOMBO JOSEPHINE W 44 ITALY I
- Page 321 and 322:
4158 BRAGOGNOLO OLINDO B 23 ITALY I
- Page 323 and 324:
4284 SANDRETTO DOMENICO H 49 ITALY
- Page 325 and 326:
APPENDIX XI CENSUS of 1930 LEGEND I
- Page 327 and 328:
63 SCOTTON JOHN B 37 ITALY ITALY IT
- Page 329 and 330:
189 ADAMI FLORA W 30 ITALY ITALY IT
- Page 331 and 332:
315 GIANNELLI GUIDO S 11 MICHIGAN I
- Page 333 and 334:
441 GIACHINO JUNE D 19 MICHIGAN ITA
- Page 335 and 336:
567 CATTANEO MARTA MIL 60 ITALY ITA
- Page 337 and 338:
693 TINETTI MARJORIE D 6 MICHIGAN I
- Page 339 and 340:
819 309 MERLO JOHN H 46 ITALY ITALY
- Page 341 and 342:
945 204 GRINDATTI VICTOR H 40 ITALY
- Page 343 and 344:
1071 411 BIANCHI NARCISO H 52 ITALY
- Page 345 and 346:
1197 GOTTA MARY D 21 MICHIGAN ITALY
- Page 347 and 348:
1323 NOTARIO TERESA W 33 ITALY ITAL
- Page 349 and 350:
1449 LENCIONI DELPHINE D 9 MICHIGAN
- Page 351 and 352:
1575 2416 DESIATTO JOHN H 45 ITALY
- Page 353 and 354:
1701 ZANIN JOHN S 4 MICHIGAN MICHIG
- Page 355 and 356:
1827 GIULIO MARY W 61 ITALY ITALY I
- Page 357 and 358:
1953 POMA HILDA W 26 MICHIGAN FINLA
- Page 359 and 360:
2079 113 SANDRETTO JOHN H 60 ITALY
- Page 361 and 362:
2205 MARTINUCCI EGIDIO B 37 MICHIGA
- Page 363 and 364:
2331 GASPARDO FRANCIS W 33 ITALY IT
- Page 365 and 366:
2457 BALCONI MARIA W 34 ITALY ITALY
- Page 367 and 368:
2583 TADDEUCCI RAIMONDO S 17 MICHIG
- Page 369 and 370:
2709 PADUAN WILL S 9 MICHIGAN ITALY
- Page 371:
2835 GASPARDO MARTIN S 21 MICHIGAN