
Create successful ePaper yourself
Turn your PDF publications into a flip-book with our unique Google optimized e-Paper software.
GUEST<br />
Data Indicators. The direct quality<br />
evaluation can be problematic<br />
for VGI. This is because usually<br />
there are no detailed specifications<br />
or the evaluation against<br />
authoritative data might not be<br />
possible, not least because there<br />
is no access to reference data.<br />
Hence, the focus is on indicators<br />
that could reveal VGI quality<br />
by solely examining VGI data.<br />
Such indicators include features’<br />
length and point density in a<br />
square-based grids or feature-level<br />
attributes such as the number<br />
of versions, the stability against<br />
changes and the corrections and<br />
rollbacks of features, the provenance<br />
of contributed features<br />
Demographic Indicators.<br />
As VGI is user generated content,<br />
it is expected that a correlation<br />
between data quality and<br />
demographic data might exist.<br />
Empirical studies revealed the<br />
correlation between the demographics<br />
of an area and the completeness<br />
and positional accuracy<br />
of the data. Also, it has been<br />
shown that the low population<br />
density areas (i.e. rural areas) negatively<br />
affect the completeness<br />
of VGI data. On the contrary,<br />
population density positively<br />
correlates with the number of<br />
contributions, thus affecting data<br />
completeness or positional accuracy<br />
(see for example Zielstra and<br />
Zipf, 2010; Haklay et al, 2010).<br />
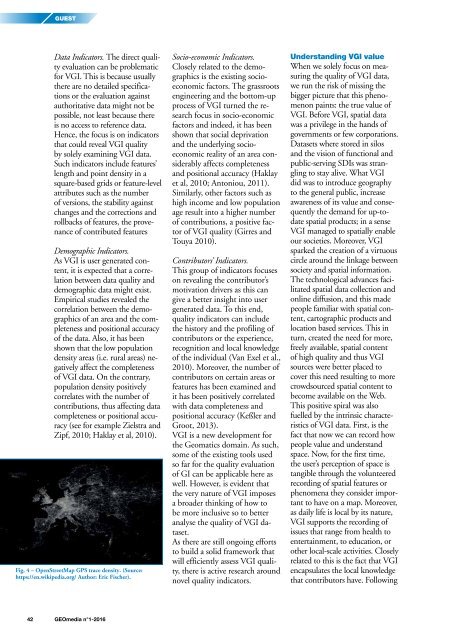
Fig. 4 – OpenStreetMap GPS trace density. (Source:<br />
https://en.wikipedia.org/ Author: Eric Fischer).<br />
Socio-economic Indicators.<br />
Closely related to the demographics<br />
is the existing socioeconomic<br />
factors. The grassroots<br />
engineering and the bottom-up<br />
process of VGI turned the research<br />
focus in socio-economic<br />
factors and indeed, it has been<br />
shown that social deprivation<br />
and the underlying socioeconomic<br />
reality of an area considerably<br />
affects completeness<br />
and positional accuracy (Haklay<br />
et al, 2010; Antoniou, 2011).<br />
Similarly, other factors such as<br />
high income and low population<br />
age result into a higher number<br />
of contributions, a positive factor<br />
of VGI quality (Girres and<br />
Touya 2010).<br />
Contributors’ Indicators.<br />
This group of indicators focuses<br />
on revealing the contributor’s<br />
motivation drivers as this can<br />
give a better insight into user<br />
generated data. To this end,<br />
quality indicators can include<br />
the history and the profiling of<br />
contributors or the experience,<br />
recognition and local knowledge<br />
of the individual (Van Exel et al.,<br />
2010). Moreover, the number of<br />
contributors on certain areas or<br />
features has been examined and<br />
it has been positively correlated<br />
with data completeness and<br />
positional accuracy (Keßler and<br />
Groot, 2013).<br />
VGI is a new development for<br />
the Geomatics domain. As such,<br />
some of the existing tools used<br />
so far for the quality evaluation<br />
of GI can be applicable here as<br />
well. However, is evident that<br />
the very nature of VGI imposes<br />
a broader thinking of how to<br />
be more inclusive so to better<br />
analyse the quality of VGI dataset.<br />
As there are still ongoing efforts<br />
to build a solid framework that<br />
will efficiently assess VGI quality,<br />
there is active research around<br />
novel quality indicators.<br />
Understanding VGI value<br />
When we solely focus on measuring<br />
the quality of VGI data,<br />
we run the risk of missing the<br />
bigger picture that this phenomenon<br />
paints: the true value of<br />
VGI. Before VGI, spatial data<br />
was a privilege in the hands of<br />
governments or few corporations.<br />
Datasets where stored in silos<br />
and the vision of functional and<br />
public-serving SDIs was strangling<br />
to stay alive. What VGI<br />
did was to introduce geography<br />
to the general public, increase<br />
awareness of its value and consequently<br />
the demand for up-todate<br />
spatial products; in a sense<br />
VGI managed to spatially enable<br />
our societies. Moreover, VGI<br />
sparked the creation of a virtuous<br />
circle around the linkage between<br />
society and spatial information.<br />
The technological advances facilitated<br />
spatial data collection and<br />
online diffusion, and this made<br />
people familiar with spatial content,<br />
cartographic products and<br />
location based services. This in<br />
turn, created the need for more,<br />
freely available, spatial content<br />
of high quality and thus VGI<br />
sources were better placed to<br />
cover this need resulting to more<br />
crowdsourced spatial content to<br />
become available on the Web.<br />
This positive spiral was also<br />
fuelled by the intrinsic characteristics<br />
of VGI data. First, is the<br />
fact that now we can record how<br />
people value and understand<br />
space. Now, for the first time,<br />
the user’s perception of space is<br />
tangible through the volunteered<br />
recording of spatial features or<br />
phenomena they consider important<br />
to have on a map. Moreover,<br />
as daily life is local by its nature,<br />
VGI supports the recording of<br />
issues that range from health to<br />
entertainment, to education, or<br />
other local-scale activities. Closely<br />
related to this is the fact that VGI<br />
encapsulates the local knowledge<br />
that contributors have. Following<br />
42 <strong>GEOmedia</strong> n°1-<strong>2016</strong>