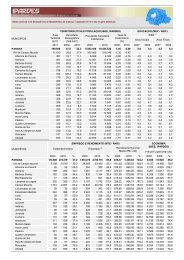
TABELA 3.4 - PESSOAS DOS GRUPOS ETÁRIO DE 10 A 13 ANOS E DE 14 A 17 ANOS, TOTAL E OCUPADAS, SEGUNDO OS MUNICÍPIOS DO TERRITÓRIO NORTE PIONEIRO - PARANÁ - 2000 PESSOAS 39 MUNICÍPIO 10 a 17 anos TOTAL 10 a 13 anos Ocupa<strong>do</strong>s 14 a 17 10 a 17 anos 10 a 13 anos 14 a 17 anos anos Abs. % Abs. % Abs. % Abatiá 1 357 658 698 446 32,9 90 13,7 356 51,0 Carlópolis 2 326 1 154 1 173 635 27,3 80 6,9 555 47,4 Congonhinhas 1 360 675 685 320 23,5 78 11,6 242 35,3 Conselheiro Mairinck 562 264 298 95 16,8 2 0,9 92 30,9 Guapirama 763 391 372 123 16,1 6 1,6 117 31,4 Ibaiti 4 330 2 159 2 171 1 072 24,8 195 9,0 877 40,4 Jaboti 761 391 370 287 37,7 74 19,0 212 57,4 Jacarezinho 6 637 3 201 3 435 922 13,9 76 2,4 846 24,6 Japira 837 409 428 284 33,9 65 16,0 218 51,0 Joaquim Távora 1 567 755 812 390 24,9 40 5,3 349 43,0 Jundiaí <strong>do</strong> Sul 560 286 274 86 15,4 7 2,3 80 29,1 Nova Fátima 1 282 621 661 280 21,8 16 2,6 264 40,0 Nova Santa Bárbara 578 294 284 174 30,1 28 9,5 146 51,4 Pinhalão 1 097 522 575 397 36,2 127 24,4 269 46,8 Quatiguá 996 524 472 304 30,5 49 9,3 255 54,0 Ribeirão Claro 1 707 805 902 475 27,8 32 4,0 442 49,0 Ribeirão <strong>do</strong> Pinhal 2 345 1 270 1 075 527 22,5 82 6,4 445 41,4 Salto <strong>do</strong> Itararé 874 445 429 248 28,4 43 9,6 206 48,0 Santa Amélia 794 374 420 186 23,4 28 7,4 158 37,7 Santa Cecília <strong>do</strong> Pavão 641 320 320 162 25,4 29 9,2 133 41,6 Santana <strong>do</strong> Itararé 916 451 464 152 16,6 19 4,2 133 28,6 Santo Antônio da Platina 6 340 3 099 3 240 1 256 19,8 173 5,6 1 082 33,4 Santo Antônio <strong>do</strong> Paraíso 462 259 203 55 11,8 0 0,0 55 26,8 São Jerônimo da Serra 2 058 1 034 1 024 569 27,7 139 13,4 431 42,1 São José da Boa Vista 1 152 619 533 219 19,0 73 11,8 146 27,4 Sapopema 1 228 671 557 253 20,6 67 9,9 186 33,4 Siqueira Campos 2 361 1 145 1 217 597 25,3 81 7,1 516 42,4 Tomazina 1 751 887 864 527 30,1 135 15,2 392 45,4 Wenceslau Braz 3 135 1 641 1 494 541 17,3 97 5,9 445 29,8 TERRITÓRIO NORTE PIONEIRO 50 777 25 325 25 452 11 580 22,8 1 932 7,6 9 649 37,9 TOTAL DO PARANÁ 1 502 974 746 331 756 642 253 256 16,9 36 458 4,9 216 798 28,7 FONTE: IBGE - Censo Demográfico (microda<strong>do</strong>s) NOTA: Da<strong>do</strong>s trabalha<strong>do</strong>s pelo IPARDES. Os municípios Jacarezinho, Jundiaí <strong>do</strong> Sul, Guapirama, Santana <strong>do</strong> Itararé e Conselheiro Mairinck registraram taxas inferiores à média estadual (16,9%) para o conjunto <strong>do</strong> segmento analisa<strong>do</strong>. De mo<strong>do</strong> geral, a grande maioria das crianças encontra-se ocupada em atividades agrossilvopastoris. Neste território, verifica-se a presença expressiva de crianças no cultivo <strong>do</strong> café, principalmente em Tomazina, Santo Antônio da Platina, Pinhalão e Ibaiti. Também sobressai o trabalho no cultivo de hortaliças, com maior concentração nos municípios de Pinhalão, São Jerônimo da Serra e Jaboti. Nas demais atividades, as crianças encontram-se distribuídas de mo<strong>do</strong> mais atomiza<strong>do</strong>, seguin<strong>do</strong> a diversidade da produção existente nos
40 municípios. No setor urbano é o serviço <strong>do</strong>méstico que incorpora o maior número de crianças, destacadamente nos municípios de Ribeirão <strong>do</strong> Pinhal e Sapopema. Ao la<strong>do</strong> dessa, sobressaem presenças pontuais na várias atividades <strong>do</strong> comércio e de serviços. Os a<strong>do</strong>lescentes encontram-se igualmente distribuí<strong>do</strong>s entre atividades <strong>do</strong>s setores urbanos e rurais. Tal como as crianças, a parcela ocupada em atividades rurais encontra-se, pre<strong>do</strong>minantemente, no cultivo <strong>do</strong> café, bastante dissemina<strong>do</strong> regionalmente, e com maior número de ocupa<strong>do</strong>s em Ibaiti, Carlópolis, Abatiá e Ribeirão Claro. Entre as demais atividades, destaca-se a ocupação no cultivo de hortaliças, em especial nos municípios de Jaboti, Wenceslau Braz, Pinhalão e São Jerônimo da Serra, e na criação de bovinos em Ibaiti, Tomazina e Sapopema. Em relação às ocupações urbanas, a parcela mais expressiva <strong>do</strong>s a<strong>do</strong>lescentes encontra-se em serviços <strong>do</strong>mésticos, destacan<strong>do</strong>-se Santo Antônio da Platina e Jacarezinho. Embora com número bem menor de ocupa<strong>do</strong>s, a construção civil situa-se entre as principais atividades que absorvem esse segmento de trabalha<strong>do</strong>res. As demais ocupações distribuem-se entre serviços de reparação e manutenção de veículos, e nas múltiplas formas de comércio e serviços, nos vários municípios. 3.2 HABITABILIDADE Este item busca traçar um quadro das condições mais gerais de habitação da população <strong>do</strong> território. Para tanto, foram analisa<strong>do</strong>s indica<strong>do</strong>res de densidade por cômo<strong>do</strong>, infra-estrutura <strong>do</strong>s <strong>do</strong>micílios e déficit habitacional. Observa-se que em 15 municípios <strong>do</strong> território o percentual de <strong>do</strong>micílios com densidade superior a duas pessoas por cômo<strong>do</strong>, 10 em 2000, era superior à média estadual. Note-se que a maioria <strong>do</strong>s municípios apresentou decréscimos nesse percentual entre 1991 e 2000. A diminuição nos percentuais de inadequação pode ser verificada tanto para o Esta<strong>do</strong> <strong>do</strong> Paraná quanto para o Brasil (tabela 3.5). 10 Critério de adequação a<strong>do</strong>ta<strong>do</strong> pelo estu<strong>do</strong> Atlas <strong>do</strong> Desenvolvimento Humano no Brasil (PNUD, 2003).
- Page 2 and 3: PROJETO DE INCLUSÃO SOCIAL E DESEN
- Page 4: APRESENTAÇÃO O Diagnóstico Socio
- Page 7 and 8: 4.3 MEIOS E INSTRUMENTOS ..........
- Page 9 and 10: 8 como também o planejamento das a
- Page 12 and 13: 11 1 CARACTERIZAÇÃO DO TERRITÓRI
- Page 14 and 15: 13 Serra Alta, Serra Geral e Teresi
- Page 16 and 17: 15 MAPA 1.4 - HIPSOMETRIA DO TERRIT
- Page 18 and 19: 17 Quanto às temperaturas máximas
- Page 20 and 21: 19 Outro levantamento de uso do sol
- Page 22: 21 MAPA 1.11 - UNIDADES DE CONSERVA
- Page 25 and 26: 24 TABELA 2.1 - POPULAÇÃO POR SIT
- Page 27 and 28: 26 que marcaram esse processo. Mais
- Page 29 and 30: 28 TABELA 2.4 - TAXA DE FECUNDIDADE
- Page 31 and 32: 30 TABELA 2.5 - POPULAÇÃO POR GRA
- Page 33 and 34: 32 Na faixa de idade intermediária
- Page 35 and 36: 34 TABELA 3.1 - ÍNDICE DE DESENVOL
- Page 37 and 38: 36 Em termos absolutos, os municíp
- Page 39: 38 Com níveis de desigualdade mais
- Page 43 and 44: 42 esgotamento sanitário os domic
- Page 45 and 46: 44 Visto globalmente, o território
- Page 47 and 48: 46 TABELA 3.9 - POPULAÇÃO, TOTAL
- Page 49 and 50: 48 TABELA 3.10 - TOTAL DE NASCIDOS
- Page 51 and 52: 50 as causas infecciosas e parasit
- Page 53 and 54: TABELA 3.11 - NÚMERO TOTAL E DISTR
- Page 55 and 56: TABELA 3.12 - NÚMERO DE HOSPITAIS
- Page 57 and 58: 56 Outro aspecto importante a ser a
- Page 59 and 60: TABELA 3.14 - COBERTURA DA REDE DE
- Page 61 and 62: 60 Como agravante dessa realidade t
- Page 63 and 64: 62 TABELA 3.17 - ESTABELECIMENTOS D
- Page 65 and 66: 64 Quanto à taxa média de aprova
- Page 67 and 68: 66 Tomando como meta de atendimento
- Page 69 and 70: 68 TABELA 3.21 - CRIANÇAS ATENDIDA
- Page 71 and 72: 70 atividades típicas da área urb
- Page 73 and 74: 72 TABELA 3.24 - NÚMERO DE ENTIDAD
- Page 75 and 76: 74 QUADRO 3.1 - POSICIONAMENTO DOS
- Page 77 and 78: 76 3.7 TURISMO E EQUIPAMENTOS CULTU
- Page 79 and 80: TABELA 3.26 - EQUIPAMENTOS CULTURAI
- Page 81 and 82: 80 TABELA 4.2 - VALOR ADICIONADO, S
- Page 83 and 84: 82 População Economicamente Ativa
- Page 85 and 86: 84 TABELA 4.6 - TOTAL DE OCUPAÇÕE
- Page 87 and 88: TABELA 4.7 - TOTAL DE PESSOAS COM 1
- Page 89 and 90: 88 4.1.3 Evolução do Emprego Form
- Page 91 and 92:
90 TABELA 4.11 - EMPREGO FORMAL, SE
- Page 93 and 94:
92 Essas duas atividades, somadas
- Page 95 and 96:
94 O aparelho industrial existente
- Page 97 and 98:
96 2005, essa participação subiu
- Page 99 and 100:
98 estabelecimento não-familiar, q
- Page 101 and 102:
100 Entre os anos 1970 e 1985, ocor
- Page 103 and 104:
102 O conjunto de estabelecimentos
- Page 105 and 106:
104 TABELA 4.29 - NÚMERO DE CABEÇ
- Page 107 and 108:
106 TABELA 4.32 - NÚMERO DE EMPREE
- Page 109 and 110:
108 O PRONAF foi criado por meio do
- Page 111 and 112:
TABELA 4.36 - NÚMERO DE CONTRATOS
- Page 113 and 114:
112 TABELA 4.37 - NÚMERO DE OPERA
- Page 115 and 116:
114 TABELA 4.39 - VALOR CONTRATADO
- Page 117 and 118:
116 Sistema Aeroportuário O territ
- Page 119 and 120:
118 4.5.2 Resultados O Norte Pionei
- Page 121 and 122:
120
- Page 123 and 124:
122 TABELA 5.1 - TOTAL DA POPULAÇ
- Page 125 and 126:
124 A análise das despesas dos mun
- Page 127 and 128:
126 Para a seleção dos ativos, fo
- Page 129 and 130:
128 No território estão organizad
- Page 131 and 132:
130 Serra (um) e Sapopema (um). Des
- Page 133 and 134:
132 5.4.1 Associações de Municíp
- Page 135 and 136:
134
- Page 137 and 138:
136 distância, resultando em saldo
- Page 139 and 140:
138 Municípios (FPM). As despesas
- Page 141 and 142:
140 IDENTIFICAÇÃO, caracterizaç
- Page 143 and 144:
142
- Page 145 and 146:
144 TABELA A.2.3 - IMIGRANTES DE DA
- Page 147 and 148:
146 TABELA A.2.5 - IMIGRANTES DE DA
- Page 149 and 150:
148 TABELA A.2.9 - POPULAÇÃO POR
- Page 151 and 152:
TABELA A.3.1 - NÚMERO MÉDIO E DIS
- Page 153 and 154:
TABELA A.4.1 - NÚMERO E PARTICIPA
- Page 155:
154 QUADRO A.5.1 - CURSOS PROFISSIO