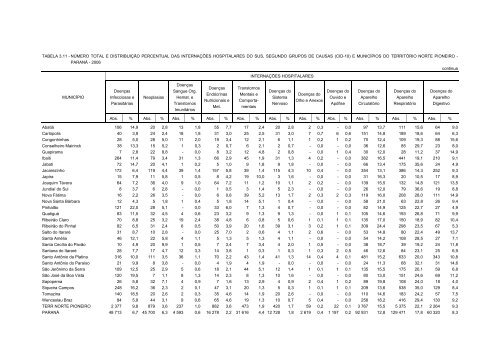
TABELA 3.11 - NÚMERO TOTAL E DISTRIBUIÇÃO PERCENTUAL DAS INTERNAÇÕES HOSPITALARES DO SUS, SEGUNDO GRUPOS DE CAUSAS (CID-10) E MUNICÍPIOS DO TERRITÓRIO NORTE PIONEIRO - PARANÁ - 2006 continua INTERNAÇÕES HOSPITALARES MUNICÍPIO Doenças Infecciosas e Parasitárias Neoplasias Doenças Sangue Org. Hemat. e Transtornos Imunitários Doenças Endócrinas Nutricionais e Met. Transtornos Mentais e Comportamentais Doenças <strong>do</strong> Sistema Nervoso Doenças <strong>do</strong> Olho e Anexos Doenças <strong>do</strong> Ouvi<strong>do</strong> e Apófise Doenças <strong>do</strong> Aparelho Circulatório Doenças <strong>do</strong> Aparelho Respiratório Doenças <strong>do</strong> Aparelho Digestivo Abs. % Abs. % Abs. % Abs. % Abs. % Abs. % Abs. % Abs. % Abs. % Abs. % Abs. % Abatiá 106 14,9 20 2,8 13 1,8 55 7,7 17 2,4 20 2,8 2 0,3 - 0,0 97 13,7 111 15,6 64 9,0 Carlópolis 40 3,9 24 2,4 18 1,8 31 3,0 25 2,5 31 3,0 7 0,7 6 0,6 151 14,8 189 18,6 64 6,3 Congonhinhas 28 5,0 28 5,0 11 2,0 19 3,4 12 2,1 6 1,1 1 0,2 1 0,2 70 12,4 109 19,3 88 15,6 Conselheiro Mairinck 38 13,3 15 5,2 1 0,3 2 0,7 6 2,1 2 0,7 - 0,0 - 0,0 36 12,6 85 29,7 23 8,0 Guapirama 7 2,8 22 8,8 - 0,0 8 3,2 12 4,8 2 0,8 - 0,0 1 0,4 30 12,0 28 11,2 37 14,9 Ibaiti 264 11,4 79 3,4 31 1,3 66 2,9 45 1,9 31 1,3 4 0,2 - 0,0 382 16,5 441 19,1 210 9,1 Jaboti 72 14,7 20 4,1 1 0,2 5 1,0 9 1,8 9 1,8 - 0,0 - 0,0 66 13,4 175 35,6 24 4,9 Jacarezinho 172 6,4 119 4,4 39 1,4 157 5,8 39 1,4 115 4,3 10 0,4 - 0,0 354 13,1 386 14,3 252 9,3 Japira 15 7,9 11 5,8 1 0,5 8 4,2 19 10,0 3 1,6 - 0,0 - 0,0 31 16,3 20 10,5 17 8,9 Joaquim Távora 64 7,2 36 4,0 9 1,0 64 7,2 11 1,2 10 1,1 2 0,2 - 0,0 139 15,5 132 14,8 121 13,5 Jundiaí <strong>do</strong> Sul 8 3,7 6 2,8 - 0,0 1 0,5 3 1,4 5 2,3 - 0,0 - 0,0 26 12,0 79 36,6 19 8,8 Nova Fátima 16 2,2 26 3,5 - 0,0 6 0,8 39 5,2 13 1,7 2 0,3 2 0,3 119 16,0 208 28,0 111 14,9 Nova Santa Bárbara 12 4,3 5 1,8 1 0,4 5 1,8 14 5,1 1 0,4 - 0,0 - 0,0 58 21,0 63 22,8 26 9,4 Pinhalão 121 22,0 28 5,1 - 0,0 33 6,0 7 1,3 4 0,7 - 0,0 - 0,0 82 14,9 125 22,7 27 4,9 Quatiguá 83 11,5 32 4,5 4 0,6 23 3,2 9 1,3 9 1,3 - 0,0 1 0,1 105 14,6 193 26,8 71 9,9 Ribeirão Claro 70 8,8 25 3,2 19 2,4 38 4,8 6 0,8 5 0,6 1 0,1 1 0,1 135 17,0 150 18,9 82 10,4 Ribeirão <strong>do</strong> Pinhal 82 6,5 31 2,4 6 0,5 50 3,9 20 1,6 39 3,1 3 0,2 1 0,1 309 24,4 298 23,5 67 5,3 Salto <strong>do</strong> Itararé 31 8,7 10 2,8 - 0,0 25 7,0 2 0,6 4 1,1 2 0,6 - 0,0 53 14,8 80 22,4 49 13,7 Santa Amélia 46 12,1 22 5,8 4 1,1 5 1,3 5 1,3 4 1,1 - 0,0 - 0,0 54 14,2 108 28,5 27 7,1 Santa Cecília <strong>do</strong> Pavão 10 4,9 20 9,9 1 0,5 7 3,4 7 3,4 4 2,0 1 0,5 - 0,0 38 18,7 39 19,2 24 11,8 Santana <strong>do</strong> Itararé 28 7,7 17 4,7 12 3,3 14 3,8 1 0,3 1 0,3 1 0,3 2 0,5 46 12,6 84 23,1 25 6,9 Santo Antônio da Platina 316 10,0 111 3,5 36 1,1 70 2,2 43 1,4 41 1,3 14 0,4 4 0,1 481 15,2 633 20,0 343 10,8 Santo Antônio <strong>do</strong> Paraíso 21 9,9 8 3,8 - 0,0 4 1,9 4 1,9 - 0,0 - 0,0 - 0,0 24 11,3 68 32,1 31 14,6 São Jerônimo da Serra 109 12,5 25 2,9 5 0,6 18 2,1 44 5,1 12 1,4 1 0,1 1 0,1 135 15,5 175 20,1 59 6,8 São José da Boa Vista 120 19,5 7 1,1 8 1,3 14 2,3 8 1,3 10 1,6 - 0,0 - 0,0 80 13,0 151 24,6 69 11,2 Sapopema 26 5,8 32 7,1 4 0,9 7 1,6 13 2,9 4 0,9 2 0,4 1 0,2 89 19,8 108 24,0 18 4,0 Siqueira Campos 248 16,2 36 2,3 2 0,1 47 3,1 20 1,3 5 0,3 1 0,1 1 0,1 209 13,6 538 35,0 129 8,4 Tomazina 140 18,5 20 2,6 2 0,3 35 4,6 14 1,9 20 2,6 - 0,0 - 0,0 110 14,6 183 24,2 57 7,5 Wenceslau Braz 84 5,9 44 3,1 9 0,6 65 4,6 19 1,3 10 0,7 5 0,4 - 0,0 258 18,2 416 29,4 130 9,2 TERR NORTE PIONEIRO 2 377 9,8 879 3,6 237 1,0 882 3,6 473 1,9 420 1,7 59 0,2 22 0,1 3 767 15,5 5 375 22,1 2 264 9,3 PARANÁ 48 713 6,7 45 700 6,3 4 593 0,6 16 278 2,2 31 616 4,4 12 728 1,8 2 619 0,4 1 197 0,2 92 931 12,8 129 471 17,8 60 320 8,3
TABELA 3.11 - NÚMERO TOTAL E DISTRIBUIÇÃO PERCENTUAL DAS INTERNAÇÕES HOSPITALARES DO SUS, SEGUNDO GRUPOS DE CAUSAS (CID-10) E MUNICÍPIOS DO TERRITÓRIO NORTE PIONEIRO - PARANÁ - 2006 conclusão INTERNAÇÕES HOSPITALARES MUNICÍPIO Doenças da Pele e Teci<strong>do</strong> Subcutâneo Doenças <strong>do</strong> Sistema Ósteomuscular e Teci<strong>do</strong> Conj. Doenças <strong>do</strong> Ap. Geniturinário Gravidez, Parto e Puerpério Algumas Afec. Origin. Per. Perinatal Malf. Cong. Deform. e Anom. Cromos. Sint. Sinais e Acha<strong>do</strong>s Anormais Lesões e Envenenamentos Causas Externas de Morb. e Mort. Contatos com Serviços de Saúde TOTAL Abs. % Abs. % Abs. % Abs. % Abs. % Abs. % Abs. % Abs. % Abs. % Abs. % Abs. % Abatiá 5 0,7 13 1,8 67 9,4 73 10,3 4 0,6 1 0,1 4 0,6 35 4,9 - 0 3 0,4 710 100,0 Carlópolis 3 0,3 17 1,7 124 12,2 152 14,9 11 1,1 1 0,1 53 5,2 61 6,0 - 0 10 1,0 1 018 100,0 Congonhinhas 4 0,7 15 2,7 48 8,5 100 17,7 1 0,2 7 1,2 2 0,4 13 2,3 - 0 1 0,2 564 100,0 Conselheiro Mairinck 1 0,3 1 0,3 23 8,0 40 14,0 - 0,0 - 0,0 - 0,0 13 4,5 - 0 - 0,0 286 100,0 Guapirama 8 3,2 4 1,6 15 6,0 45 18,1 2 0,8 3 1,2 2 0,8 19 7,6 - 0 4 1,6 249 100,0 Ibaiti 16 0,7 47 2,0 158 6,8 322 13,9 19 0,8 18 0,8 10 0,4 163 7,1 - 0 6 0,3 2 312 100,0 Jaboti 4 0,8 8 1,6 53 10,8 31 6,3 3 0,6 1 0,2 1 0,2 8 1,6 - 0 1 0,2 491 100,0 Jacarezinho 46 1,7 101 3,7 201 7,4 410 15,2 3 0,1 16 0,6 19 0,7 231 8,6 - 0 31 1,1 2 701 100,0 Japira 1 0,5 2 1,1 18 9,5 24 12,6 1 0,5 2 1,1 1 0,5 16 8,4 - 0 - 0,0 190 100,0 Joaquim Távora 2 0,2 34 3,8 59 6,6 132 14,8 5 0,6 1 0,1 14 1,6 50 5,6 - 0 9 1,0 894 100,0 Jundiaí <strong>do</strong> Sul 1 0,5 1 0,5 16 7,4 31 14,4 3 1,4 3 1,4 - 0,0 14 6,5 - 0 - 0,0 216 100,0 Nova Fátima - 0,0 26 3,5 52 7,0 61 8,2 8 1,1 4 0,5 4 0,5 44 5,9 - 0 3 0,4 744 100,0 Nova Santa Bárbara 2 0,7 4 1,4 19 6,9 44 15,9 2 0,7 1 0,4 1 0,4 17 6,2 - 0 1 0,4 276 100,0 Pinhalão 2 0,4 3 0,5 38 6,9 60 10,9 - 0,0 5 0,9 2 0,4 13 2,4 - 0 1 0,2 551 100,0 Quatiguá 15 2,1 7 1,0 51 7,1 85 11,8 2 0,3 4 0,6 12 1,7 12 1,7 - 0 1 0,1 719 100,0 Ribeirão Claro 8 1,0 18 2,3 80 10,1 97 12,2 8 1,0 4 0,5 1 0,1 37 4,7 - 0 7 0,9 792 100,0 Ribeirão <strong>do</strong> Pinhal 11 0,9 24 1,9 66 5,2 186 14,7 17 1,3 5 0,4 - 0,0 48 3,8 - 0 3 0,2 1 266 100,0 Salto <strong>do</strong> Itararé 1 0,3 6 1,7 49 13,7 32 9,0 1 0,3 2 0,6 1 0,3 9 2,5 - 0 - 0,0 357 100,0 Santa Amélia 5 1,3 3 0,8 37 9,8 38 10,0 4 1,1 2 0,5 3 0,8 12 3,2 - 0 - 0,0 379 100,0 Santa Cecília <strong>do</strong> Pavão 4 2,0 3 1,5 9 4,4 24 11,8 1 0,5 2 1,0 - 0,0 9 4,4 - 0 - 0,0 203 100,0 Santana <strong>do</strong> Itararé 5 1,4 7 1,9 51 14,0 55 15,1 6 1,6 - 0,0 3 0,8 4 1,1 - 0 2 0,5 364 100,0 Santo Antônio da Platina 22 0,7 64 2,0 237 7,5 462 14,6 50 1,6 19 0,6 14 0,4 190 6,0 - 0 21 0,7 3 171 100,0 Santo Antônio <strong>do</strong> Paraíso 2 0,9 - 0,0 28 13,2 8 3,8 - 0,0 - 0,0 - 0,0 13 6,1 - 0 1 0,5 212 100,0 São Jerônimo da Serra 6 0,7 2 0,2 56 6,4 168 19,3 3 0,3 1 0,1 5 0,6 45 5,2 - 0 1 0,1 871 100,0 São José da Boa Vista 3 0,5 31 5,0 64 10,4 24 3,9 4 0,7 4 0,7 - 0,0 18 2,9 - 0 - 0,0 615 100,0 Sapopema 5 1,1 1 0,2 31 6,9 82 18,2 - 0,0 4 0,9 - 0,0 23 5,1 - 0 - 0,0 450 100,0 Siqueira Campos 14 0,9 31 2,0 82 5,3 111 7,2 10 0,7 4 0,3 11 0,7 34 2,2 - 0 2 0,1 1 535 100,0 Tomazina 12 1,6 11 1,5 36 4,8 83 11,0 3 0,4 3 0,4 2 0,3 25 3,3 - 0 - 0,0 756 100,0 Wenceslau Braz 16 1,1 18 1,3 88 6,2 160 11,3 7 0,5 9 0,6 19 1,3 59 4,2 - 0 1 0,1 1 417 100,0 TERR NORTE PIONEIRO 224 0,9 502 2,1 1 856 7,6 3 140 12,9 178 0,7 126 0,5 184 0,8 1 235 5,1 0 0 109 0,4 24 309 100,0 PARANÁ 9 518 1,3 18 929 2,6 41 250 5,7 116 531 16,1 9 957 1,4 5 658 0,8 7 715 1,1 53 693 7,4 49 0,0 15 968 2,2 725 434 100,0 FONTE: Ministério da Saúde - Sistema de Informações Hospitalares <strong>do</strong> SUS (SIH/SUS) NOTA: Da<strong>do</strong>s trabalha<strong>do</strong>s pelo IPARDES.
- Page 2 and 3: PROJETO DE INCLUSÃO SOCIAL E DESEN
- Page 4: APRESENTAÇÃO O Diagnóstico Socio
- Page 7 and 8: 4.3 MEIOS E INSTRUMENTOS ..........
- Page 9 and 10: 8 como também o planejamento das a
- Page 12 and 13: 11 1 CARACTERIZAÇÃO DO TERRITÓRI
- Page 14 and 15: 13 Serra Alta, Serra Geral e Teresi
- Page 16 and 17: 15 MAPA 1.4 - HIPSOMETRIA DO TERRIT
- Page 18 and 19: 17 Quanto às temperaturas máximas
- Page 20 and 21: 19 Outro levantamento de uso do sol
- Page 22: 21 MAPA 1.11 - UNIDADES DE CONSERVA
- Page 25 and 26: 24 TABELA 2.1 - POPULAÇÃO POR SIT
- Page 27 and 28: 26 que marcaram esse processo. Mais
- Page 29 and 30: 28 TABELA 2.4 - TAXA DE FECUNDIDADE
- Page 31 and 32: 30 TABELA 2.5 - POPULAÇÃO POR GRA
- Page 33 and 34: 32 Na faixa de idade intermediária
- Page 35 and 36: 34 TABELA 3.1 - ÍNDICE DE DESENVOL
- Page 37 and 38: 36 Em termos absolutos, os municíp
- Page 39 and 40: 38 Com níveis de desigualdade mais
- Page 41 and 42: 40 municípios. No setor urbano é
- Page 43 and 44: 42 esgotamento sanitário os domic
- Page 45 and 46: 44 Visto globalmente, o território
- Page 47 and 48: 46 TABELA 3.9 - POPULAÇÃO, TOTAL
- Page 49 and 50: 48 TABELA 3.10 - TOTAL DE NASCIDOS
- Page 51: 50 as causas infecciosas e parasit
- Page 55 and 56: TABELA 3.12 - NÚMERO DE HOSPITAIS
- Page 57 and 58: 56 Outro aspecto importante a ser a
- Page 59 and 60: TABELA 3.14 - COBERTURA DA REDE DE
- Page 61 and 62: 60 Como agravante dessa realidade t
- Page 63 and 64: 62 TABELA 3.17 - ESTABELECIMENTOS D
- Page 65 and 66: 64 Quanto à taxa média de aprova
- Page 67 and 68: 66 Tomando como meta de atendimento
- Page 69 and 70: 68 TABELA 3.21 - CRIANÇAS ATENDIDA
- Page 71 and 72: 70 atividades típicas da área urb
- Page 73 and 74: 72 TABELA 3.24 - NÚMERO DE ENTIDAD
- Page 75 and 76: 74 QUADRO 3.1 - POSICIONAMENTO DOS
- Page 77 and 78: 76 3.7 TURISMO E EQUIPAMENTOS CULTU
- Page 79 and 80: TABELA 3.26 - EQUIPAMENTOS CULTURAI
- Page 81 and 82: 80 TABELA 4.2 - VALOR ADICIONADO, S
- Page 83 and 84: 82 População Economicamente Ativa
- Page 85 and 86: 84 TABELA 4.6 - TOTAL DE OCUPAÇÕE
- Page 87 and 88: TABELA 4.7 - TOTAL DE PESSOAS COM 1
- Page 89 and 90: 88 4.1.3 Evolução do Emprego Form
- Page 91 and 92: 90 TABELA 4.11 - EMPREGO FORMAL, SE
- Page 93 and 94: 92 Essas duas atividades, somadas
- Page 95 and 96: 94 O aparelho industrial existente
- Page 97 and 98: 96 2005, essa participação subiu
- Page 99 and 100: 98 estabelecimento não-familiar, q
- Page 101 and 102: 100 Entre os anos 1970 e 1985, ocor
- Page 103 and 104:
102 O conjunto de estabelecimentos
- Page 105 and 106:
104 TABELA 4.29 - NÚMERO DE CABEÇ
- Page 107 and 108:
106 TABELA 4.32 - NÚMERO DE EMPREE
- Page 109 and 110:
108 O PRONAF foi criado por meio do
- Page 111 and 112:
TABELA 4.36 - NÚMERO DE CONTRATOS
- Page 113 and 114:
112 TABELA 4.37 - NÚMERO DE OPERA
- Page 115 and 116:
114 TABELA 4.39 - VALOR CONTRATADO
- Page 117 and 118:
116 Sistema Aeroportuário O territ
- Page 119 and 120:
118 4.5.2 Resultados O Norte Pionei
- Page 121 and 122:
120
- Page 123 and 124:
122 TABELA 5.1 - TOTAL DA POPULAÇ
- Page 125 and 126:
124 A análise das despesas dos mun
- Page 127 and 128:
126 Para a seleção dos ativos, fo
- Page 129 and 130:
128 No território estão organizad
- Page 131 and 132:
130 Serra (um) e Sapopema (um). Des
- Page 133 and 134:
132 5.4.1 Associações de Municíp
- Page 135 and 136:
134
- Page 137 and 138:
136 distância, resultando em saldo
- Page 139 and 140:
138 Municípios (FPM). As despesas
- Page 141 and 142:
140 IDENTIFICAÇÃO, caracterizaç
- Page 143 and 144:
142
- Page 145 and 146:
144 TABELA A.2.3 - IMIGRANTES DE DA
- Page 147 and 148:
146 TABELA A.2.5 - IMIGRANTES DE DA
- Page 149 and 150:
148 TABELA A.2.9 - POPULAÇÃO POR
- Page 151 and 152:
TABELA A.3.1 - NÚMERO MÉDIO E DIS
- Page 153 and 154:
TABELA A.4.1 - NÚMERO E PARTICIPA
- Page 155:
154 QUADRO A.5.1 - CURSOS PROFISSIO