PDF 19 MB - Grupa PSB
PDF 19 MB - Grupa PSB
PDF 19 MB - Grupa PSB

You also want an ePaper? Increase the reach of your titles
YUMPU automatically turns print PDFs into web optimized ePapers that Google loves.
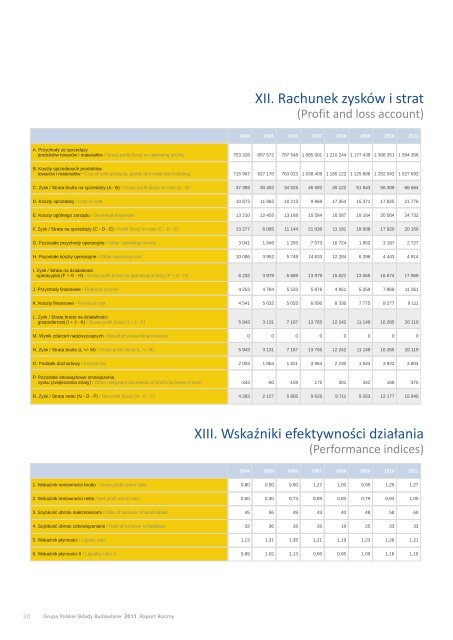
XII. Rachunek zysków i strat<br />
(Profit and loss account)<br />
2004 2005 2006 2007 2008 2009 2010 2011<br />
A. Przychody ze sprzedaży<br />
produktów towarów i materiałów / Gross profit (loss) on operating activity<br />
753 326 657 572 797 548 1 085 001 1 210 244 1 177 439 1 308 351 1 594 356<br />
B. Koszty sprzedanych produktów,<br />
towarów i materiałów / Cost of sold products, goods and materials including<br />
C. Zysk / Strata brutto na sprzedaży (A - B) / Gross profit (loss) on sale (A - B)<br />
D. Koszty sprzedaży / Cost of sale<br />
E. Koszty ogólnego zarządu / Overhead expenses<br />
F. Zysk / Strata na sprzedaży (C - D - E) / Profit (loss) on sale (C - D - E)<br />
G. Pozostałe przychody operacyjne / Other operating income<br />
H. Pozostałe koszty operacyjne / Other operating cost<br />
715 967 627 170 763 023 1 038 409 1 165 122 1 125 896 1 252 042 1 527 692<br />
37 359 30 402 34 525 46 592 45 122 51 543 56 309 66 664<br />
10 872 11 862 10 213 9 969 17 354 15 371 17 825 21 776<br />
13 210 12 455 13 168 15 584 16 587 18 164 20 564 24 732<br />
13 277 6 085 11 144 21 039 11 181 18 008 17 920 20 156<br />
3 041 1 846 1 293 7 573 16 724 1 853 3 <strong>19</strong>7 2 727<br />
10 086 3 952 5 748 14 633 12 284 6 296 4 443 4 914<br />
I. Zysk / Strata na działalnosci<br />
operacyjnej (F + G - H) / Gross profit (loss) on operating activity (F + G - H)<br />
J. Przychody finansowe / Financial income<br />
K. Koszty finansowe / Financial cost<br />
6 232 3 979 6 689 13 979 15 621 13 565 16 674 17 969<br />
4 252 4 784 5 533 5 876 4 951 5 359 7 868 11 261<br />
4 541 5 632 5 055 6 090 8 330 7 775 8 277 9 111<br />
L. Zysk / Strata brutto na działalności<br />
gospodarczej (I + J - K) / Gross profit (loss) (I + J - K)<br />
M. Wynik zdarzeń nadzwyczajnych / Result of extraordinary events<br />
N. Zysk / Strata brutto (L +/- M) / Gross profit (loss) (L +/- M)<br />
O. Podatek dochodowy / Income tax<br />
5 943 3 131 7 167 13 765 12 242 11 149 16 265 20 1<strong>19</strong><br />
0 0 0 0 0 0 0 0<br />
5 943 3 131 7 167 13 765 12 242 11 149 16 265 20 1<strong>19</strong><br />
2 003 1 064 1 521 3 964 2 230 1 544 3 922 3 804<br />
P. Pozostałe obowiązkowe zmniejszenia<br />
zysku (zwiększenia straty) / Other obligatory decreases of profit (increase of loss)<br />
R. Zysk / Strata netto (N - O - P) / Net profit (loss) (N - O - P)<br />
-343 -60 -159 175 301 342 166 375<br />
4 283 2 127 5 805 9 626 9 711 9 263 12 177 15 940<br />
XIII. Wskaźniki efektywności działania<br />
(Performance indices)<br />
2004 2005 2006 2007 2008 2009 2010 2011<br />
1. Wskaźnik rentowności brutto / Gross profit return ratio<br />
2. Wskaźnik rentowności netto / Net profit return ratio<br />
3. Szybkość obrotu należnościami / Rate of turnover of receivables<br />
4. Szybkość obrotu zobowiązaniami / Rate of turnover of liabilities<br />
5. Wskaźnik płynności / Liqidity ratio<br />
6. Wskaźnik płynności II / Liquidity ratio II<br />
0,80 0,50 0,90 1,27 1,00 0,95 1,25 1,27<br />
0,60 0,30 0,73 0,89 0,80 0,79 0,93 1,00<br />
45 56 49 43 40 48 58 60<br />
32 36 28 26 <strong>19</strong> 25 33 33<br />
1,13 1,31 1,35 1,21 1,<strong>19</strong> 1,23 1,26 1,21<br />
0,89 1,02 1,13 0,96 0,95 1,09 1,16 1,10<br />
30<br />
<strong>Grupa</strong> Polskie Składy Budowlane 2011 Raport Roczny