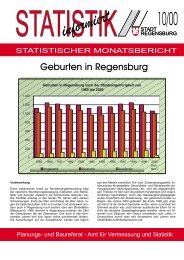
251 14.5 Geburten Jahr <strong>Regensburg</strong> Bayern Bundesrepublik früheres Bundesgebiet Neue Län<strong>der</strong> und Berlin-Ost <strong>Regensburg</strong> Bayern Bundesrepublik früheres Bundesgebiet Neue Län<strong>der</strong> und Berlin-Ost absolut je 1000 Einwohner 1946 . 156.302 921.677 732.998 188.679 . 18,6 14,3 15,9 10,2 1947 . 169.829 1.028.696 781.421 247.275 . 18,5 15,6 16,6 13,1 1948 . 162.571 1.049.385 806.074 243.311 . 17,5 15,5 16,7 12,7 1949 . 156.253 1.106.825 832.803 274.022 . 16,7 16,3 16,9 14,5 1950 . 151.752 1.116.701 812.835 303.866 16,6 16,3 16,3 16,5 1951 . 147.127 1.106.380 795.608 310.772 . 16,1 16,1 15,7 16,9 1952 . 146.991 1.105.084 799.080 306.004 . 16,0 15,9 15,7 16,6 1953 . 143.618 1.095.029 796.096 298.933 . 15,7 15,7 15,5 16,4 1954 1.637 144.783 1.109.743 816.028 293.715 . 15,8 15,9 15,7 16,3 1955 . 145.122 1.113.408 820.128 293.280 . 15,8 15,8 15,7 16,3 1956 . 152.876 1.137.169 855.887 281.282 . 16,8 16,0 16,1 15,8 1957 . 158.839 1.165.555 892.228 273.327 . 17,3 16,4 16,6 15,6 1958 1.669 161.443 1.175.870 904.465 271.405 13,6 17,5 16,4 16,7 15,6 1959 1.749 168.150 1.243.922 951.942 291.980 14,1 18,0 17,2 17,3 16,9 1960 1.736 171.665 1.261.614 968.629 292.985 13,9 18,2 17,3 17,4 16,9 1961 1.826 180.000 1.313.505 1.012.687 300.818 14,7 18,9 17,9 18,0 17,6 1962 1.831 180.224 1.316.534 1.018.552 297.982 14,7 18,6 17,8 17,9 17,4 1963 1.881 184.674 1.355.595 1.054.123 301.472 15,0 18,8 18,2 18,4 17,6 1964 1.784 185.326 1.357.304 1.065.437 291.867 14,3 18,7 18,1 18,3 17,1 1965 1.734 180.739 1.325.386 1.044.328 281.058 13,8 18,0 17,5 17,8 16,5 1966 1.736 181.559 1.318.303 1.050.345 267.958 13,8 17,8 17,3 17,8 15,7 1967 1.646 176.362 1.272.276 1.019.459 252.817 13,1 17,2 16,7 17,2 14,8 1968 1.663 168.403 1.214.968 969.825 245.143 13,2 16,3 15,8 16,3 14,3 1969 1.493 154.394 1.142.366 903.456 238.910 11,7 15,1 14,8 15,0 14,0 1970 1.394 143.656 1.047.737 810.808 236.929 10,7 13,7 13,5 13,4 13,9 1971 1.174 137.465 1.013.396 778.526 234.870 8,9 12,9 12,9 12,7 13,8 1972 1.166 125.110 901.657 701.214 200.443 8,8 11,7 11,4 11,3 11,7 1973 1.044 114.658 815.969 635.633 180.336 7,8 10,6 10,3 10,3 10,6 1974 1.099 114.060 805.500 626.373 179.127 8,2 10,5 10,2 10,1 10,6 1975 1.026 108.544 782.310 600.512 181.798 7,8 10,0 9,9 9,7 10,8 1976 977 108.995 798.334 602.851 195.483 7,5 10,1 10,2 9,8 11,6 1977 907 106.633 805.496 582.344 223.152 6,9 9,9 10,3 9,5 13,3 1978 911 106.145 808.619 576.468 232.151 6,8 9,8 10,4 9,4 13,9 1979 943 107.667 817.217 581.984 235.233 7,1 9,9 10,5 9,5 14,0 1980 1.045 114.451 865.789 620.657 245.132 7,9 10,5 11,0 10,1 14,6 1981 1.021 117.083 862.100 624.557 237.543 7,7 10,7 11,0 10,1 14,2 1982 1.036 116.576 861.275 621.173 240.102 7,9 10,6 11,0 10,1 14,4 1983 1.006 112.644 827.933 594.177 233.756 7,7 10,3 10,6 9,7 14,0 1984 926 111.183 812.292 584.157 228.135 7,2 10,1 10,4 9,5 13,6 1985 916 111.365 813.803 586.155 227.648 7,1 10,2 10,5 9,6 13,7 1986 1.048 118.439 848.232 625.963 222.269 8,1 10,8 10,9 10,3 13,4 1987 963 119.623 867.969 642.010 225.959 7,5 10,8 11,2 10,5 13,6 1988 1.142 126.409 892.993 677.259 215.734 8,9 11,5 11,4 11,0 12,9 1989 1.121 127.029 880.459 681.537 198.922 8,6 11,4 11,2 11,0 12,0 1990 1.246 136.122 905.675 727.199 178.476 9,5 12,0 11,4 11,5 11,1 1991 1.221 134.400 830.019 722.250 107.769 9,1 11,7 10,4 11,3 6,8 1992 1.197 133.946 809.114 720.794 88.320 8,8 11,5 10,0 11,1 5,6 1993 1.194 133.897 798.447 717.915 80.532 8,6 11,3 9,8 11,0 5,1 1994 1.122 127.828 768.603 690.905 78.698 8,0 10,8 9,5 10,5 5,1 1995 1.157 125.995 765.221 681.374 83.847 8,2 10,5 9,4 10,3 5,4 1996 1.162 129.376 796.013 702.688 93.325 8,2 10,8 9,7 10,5 6,0 1997 1.220 130.517 812.173 711.915 100.258 8,6 10,8 9,9 10,7 6,5 1998 1.252 126.529 785.034 682.172 102.862 8,9 10,5 9,6 10,2 6,7 1999 1.203 123.244 770.744 664.018 106.726 8,5 10,2 9,4 9,9 7,0 2000 1.148 120.765 766.969 655.701 111.268 8,1 9,9 9,3 9,8 7,3 <strong>2001</strong> 1.197 . . . . 8,3 . . . . Quelle: <strong>Stadt</strong> <strong>Regensburg</strong> - Bevölkerungsfortschreibung; Bayer. Landesamt für <strong>Statistik</strong> und Datenverarbeitung; <strong>Statistisches</strong> Bundesamt <strong>Statistisches</strong> Jahrbuch <strong>2001</strong> <strong>der</strong> <strong>Stadt</strong> <strong>Regensburg</strong>
252 14.6 Sterbefälle Jahr <strong>Regensburg</strong> Bayern Bundesrepublik früheres Bundesgebiet Neue Län<strong>der</strong> und Berlin-Ost <strong>Regensburg</strong> Bayern Bundesrepublik früheres Bundesgebiet Neue Län<strong>der</strong> und Berlin-Ost absolut je 1000 Einwohner 1946 . 152.977 1.001.571 588.331 413.240 . 13,0 15,5 12,7 22,4 1947 . 109.709 932.663 574.628 358.035 . 11,9 14,2 12,2 19,0 1948 . 109.004 804.839 515.092 289.747 . 11,0 11,9 10,6 15,2 1949 . 99.473 770.852 517.194 253.658 . 10,6 11,3 10,5 13,4 1950 . 98.973 748.329 528.747 219.582 . 10,6 10,9 10,6 11,9 1951 . 99.650 752.697 543.897 208.800 . 10,9 10,9 10,8 11,4 1952 . 101.331 767.639 545.963 221.676 . 11,0 11,1 10,7 12,1 1953 . 105.507 790.654 578.027 212.627 . 11,5 11,4 10,3 11,7 1954 1.250 97.870 775.291 555.459 219.832 . 10,7 11,1 10,7 12,2 1955 . 103.376 795.938 581.872 214.066 . 11,3 11,3 11,1 11,9 1956 . 103.778 812.111 599.413 212.698 . 11,4 11,5 11,3 12,0 1957 . 108.041 840.195 615.016 225.179 . 11,8 11,8 11,5 12,9 1958 1.335 101.910 818.418 597.305 221.113 10,9 11,0 11,4 11,0 12,7 1959 1.312 103.550 835.402 605.504 229.898 10,6 11,1 11,6 11,0 13,3 1960 1.467 109.786 876.721 642.962 233.759 11,8 11,6 12,0 11,6 13,5 1961 1.374 106.363 850.300 627.561 222.739 11,0 11,2 11,6 11,2 13,0 1962 1.414 109.282 878.814 644.819 233.995 11,3 11,3 11,9 11,3 13,7 1963 1.481 111.973 895.070 673.069 222.001 11,8 11,4 12,0 11,7 12,9 1964 1.485 108.716 870.319 644.128 226.191 11,9 11,0 11,6 11,1 13,3 1965 1.525 114.386 907.882 677.628 230.254 12,2 11,4 12,0 11,6 13,5 1966 1.550 113.779 911.984 686.321 225.663 12,3 11,2 12,0 11,6 13,2 1967 1.565 116.529 914.417 687.349 227.068 12,5 11,4 12,0 11,6 13,3 1968 1.510 122.311 976.521 734.048 242.473 12,0 11,8 12,7 12,3 14,2 1969 1.634 126.448 988.092 744.360 243.732 12,8 12,1 12,8 12,4 14,3 1970 1.594 122.323 975.664 734.843 240.821 12,3 11,7 12,6 12,1 14,1 1971 1.632 121.803 965.623 730.670 234.953 12,4 11,5 12,3 11,9 13,8 1972 1.616 122.766 965.689 731.264 234.425 12,2 11,4 12,2 11,8 13,7 1973 1.638 123.656 962.988 731.028 231.960 12,3 11,4 12,2 11,8 13,7 1974 1.703 123.980 956.573 727.511 229.062 12,8 11,4 12,1 11,7 13,5 1975 1.692 127.931 989.649 749.260 240.389 12,8 11,8 12,6 12,1 14,3 1976 1.657 124.580 966.873 733.140 233.733 12,7 11,5 12,3 11,9 13,9 1977 1.587 120.487 931.155 704.922 226.233 12,1 11,1 11,9 11,5 13,5 1978 1.597 124.775 955.550 723.218 232.332 12,0 11,5 12,2 11,8 13,9 1979 1.532 122.271 944.474 711.732 232.742 11,6 11,3 12,1 11,6 13,9 1980 1.614 122.859 952.371 717.117 238.254 12,2 11,3 12,1 11,6 14,2 1981 1.614 122.736 954.436 722.192 232.244 12,2 11,3 12,2 11,7 13,9 1982 1.649 123.033 943.832 715.857 227.975 12,5 11,2 12,1 11,6 13,7 1983 1.637 125.362 941.032 718.337 222.695 12,6 11,4 12,1 11,7 13,3 1984 1.547 122.057 917.299 696.118 221.181 12,0 11,1 11,8 11,4 13,2 1985 1.573 121.941 929.649 704.296 225.353 12,2 11,1 12,0 11,6 13,5 1986 1.553 120.489 925.426 701.890 223.536 12,0 11,0 11,9 11,5 13,4 1987 1.534 119.662 901.291 687.419 213.876 11,9 10,8 11,6 11,3 12,8 1988 1.534 118.450 900.627 687.516 213.111 11,9 10,8 11,5 11,2 12,8 1989 1.528 121.343 903.441 697.730 205.711 11,8 10,9 11,5 11,2 12,4 1990 1.625 123.726 921.445 713.335 208.110 12,3 10,9 11,6 11,3 12,9 1991 1.638 122.276 911.245 708.818 202.427 12,2 10,6 11,4 11,1 12,7 1992 1.581 120.753 885.443 695.268 190.175 11,6 10,4 11,0 10,7 12,1 1993 1.581 122.649 897.270 711.625 185.645 11,4 10,4 11,1 10,9 11,9 1994 1.487 121.581 884.661 703.262 181.399 10,6 10,2 10,9 10,7 11,7 1995 1.458 121.992 884.588 706.493 178.095 10,4 10,2 10,8 10,7 11,5 1996 1.566 123.329 882.843 708.332 174.511 11,1 10,3 10,8 10,6 11,3 1997 1.485 121.441 860.389 692.844 167.545 10,5 10,1 10,5 10,4 10,9 1998 1.461 120.447 852.382 688.118 164.264 10,3 10,0 10,4 10,3 10,7 1999 1.386 119.519 846.330 685.045 161.285 9,8 9,9 10,3 10,3 10,6 2000 1.396 118.846 838.663 678.420 160.243 9,8 9,8 10,2 10,1 10,5 <strong>2001</strong> 1.382 . . . . 9,6 . . . . Quelle: <strong>Stadt</strong> <strong>Regensburg</strong> - Bevölkerungsfortschreibung; Bayer. Landesamt für <strong>Statistik</strong> und Datenverarbeitung; <strong>Statistisches</strong> Bundesamt <strong>Statistisches</strong> Jahrbuch <strong>2001</strong> <strong>der</strong> <strong>Stadt</strong> <strong>Regensburg</strong>
- Seite 1 und 2:
STAD T REGEN SBURG INFORMATIONEN ZU
- Seite 3 und 4:
Erläuterungen: Alle Angaben bezieh
- Seite 6 und 7:
5 Inhaltsverzeichnis Seite Erläute
- Seite 8 und 9:
7 Bevölkerungsbewegung Seite 2.14
- Seite 10 und 11:
9 8 Bildungswesen, Kultur und Freiz
- Seite 12:
11 15 Langfristige Zeitreihen Seite
- Seite 15 und 16:
Abbauland Flächen, die durch den A
- Seite 17 und 18:
16 1.2 Chronik der Stadt Regensburg
- Seite 19 und 20:
18 1924 Eingemeindung von Stadtamho
- Seite 21 und 22:
20 1986 Das auf 142 ha neu angesied
- Seite 23 und 24:
22 1.3 Allgemeine Geographische Ang
- Seite 25 und 26:
24 Bedeutendste Gewässer Flüsse/K
- Seite 27 und 28:
Stadt Regensburg Stadtbezirke der S
- Seite 29 und 30:
28 7 Reinhausen Östliche Verlänge
- Seite 31 und 32:
Entwicklung des Stadtgebietes im 20
- Seite 33 und 34:
32 1.6 Die Gemarkungen innerhalb de
- Seite 35 und 36:
34 1.9 Flächen, Einwohnerzahlen un
- Seite 37 und 38:
36 1.11 Luftdruck und Luftfeuchtigk
- Seite 39 und 40:
38 1.14 Sonstige klimatische Angabe
- Seite 41 und 42:
40 1.16 Wasserstand Donaupegel - Sc
- Seite 43 und 44:
42 1.18 Wasserstand Regenpegel - Re
- Seite 45 und 46:
44 Bevölkerung Die in diesem Stati
- Seite 47 und 48:
46 davon Jahr insgesamt Zahl Prozen
- Seite 49 und 50:
48 2.3 Bevölkerungsentwicklung 199
- Seite 51 und 52:
50 2.6 Bevölkerungsentwicklung in
- Seite 53 und 54:
52 2.9 Bevölkerung nach Altersjahr
- Seite 55 und 56:
54 2.10a Bevölkerung nach Einzelal
- Seite 57 und 58:
56 2.10b noch Bevölkerung nach Ein
- Seite 59 und 60:
58 2.11 Bevölkerung nach Altersgru
- Seite 61 und 62:
60 2.12 Bevölkerung nach besondere
- Seite 63 und 64:
62 Bevölkerungsbewegung 2.14 Kompo
- Seite 65 und 66:
64 2.16 Ehescheidungen Zahl Prozent
- Seite 67 und 68:
66 2.18 Lebendgeborene nach dem Alt
- Seite 69 und 70:
68 2.20 Selbstmorde nach Alter und
- Seite 71 und 72:
70 2.22 Zu- und Fortzüge nach Gesc
- Seite 73 und 74:
72 2.23 Umzüge innerhalb des Stadt
- Seite 75 und 76:
74 2.24 Umzüge in den Stadtbezirke
- Seite 77 und 78:
76 2.26 Einbürgerungen Zahl 1997 1
- Seite 79 und 80:
Bautätigkeitsstatistik Hochbaustat
- Seite 81 und 82:
80 3.2 Erteilte Baugenehmigungen f
- Seite 83 und 84:
82 3.4 Fertiggestellte Wohngebäude
- Seite 85 und 86:
84 3.6 Bauüberhang im Wohn- und Ni
- Seite 87 und 88:
Arbeiterstunden (Verarbeitendes Gew
- Seite 89 und 90:
88 4.2 Betriebe im Verarbeitenden G
- Seite 91 und 92:
90 4.4 Bruttolohn- und -gehaltsumme
- Seite 93 und 94:
92 4.6 Auslandsumsatz im Verarbeite
- Seite 95 und 96:
94 4.8 Bauhauptgewerbe 1) Zahl 1997
- Seite 97 und 98:
96 4.10 Gewerbean- und -abmeldungen
- Seite 99 und 100:
98 Arbeitsmarkt 4.12 Arbeitslose un
- Seite 101 und 102:
100 4.13 Arbeitslose im Stadtgebiet
- Seite 103 und 104:
102 4.14 Arbeitslose nach Berufsgru
- Seite 105 und 106:
104 4.16 Stellenvermittlungen und K
- Seite 107 und 108:
106 4.18 Beschäftigte im Öffentli
- Seite 109 und 110:
Angestellte (Industrie - Bruttomona
- Seite 111 und 112:
110 5.2 Preismesszahlen für Dienst
- Seite 113 und 114:
112 5.4 Durchschnittliche Bruttostu
- Seite 115 und 116:
114 5.6 Strom-, Gas- und Wasservers
- Seite 117 und 118:
116 5.8 Städtische Müllabfuhr und
- Seite 120 und 121:
6 Verkehr und Fremdenverkehr Tabell
- Seite 122 und 123:
121 Verkehr 6.1 Öffentlicher Perso
- Seite 124 und 125:
123 1999 2000 2001 Ankunft (t) Abga
- Seite 126 und 127:
125 6.4 Kraftfahrzeuge 1) nach dem
- Seite 128 und 129:
127 6.6 Personenkraftwagen mit Dies
- Seite 130 und 131:
129 6.8 Übernachtungen der Ausland
- Seite 132 und 133:
7 Gesundheits- und Sozialwesen Tabe
- Seite 134 und 135:
133 7.1 Erkrankungen an meldepflich
- Seite 136 und 137:
135 7.3 Krankenhauspersonal und Kra
- Seite 138 und 139:
137 7.5 Sonstige im Gesundheitswese
- Seite 140 und 141:
139 7.7 Junge Menschen nach Geschle
- Seite 142 und 143:
141 7.9 Menschen mit schweren Behin
- Seite 144 und 145:
143 7.11 Laufende Hilfe zum Lebensu
- Seite 146 und 147:
145 7.13 Hilfe in besonderen Lebens
- Seite 148 und 149:
147 7.15 Empfänger, Leistungen und
- Seite 150 und 151:
149 7.17 Altenheime und ihre Belegu
- Seite 152:
151 7.19 Rettungsdienst 1) Zahl Pro
- Seite 155 und 156:
Berufsschule Zusammen mit dem Ausbi
- Seite 157 und 158:
156 8.2 Kindergärten - einzelne Ei
- Seite 159 und 160:
158 noch 8.2 Kindergärten - einzel
- Seite 161 und 162:
160 8.3 Klassen, Schüler und Lehrk
- Seite 163 und 164:
162 8.4 Berufsaufbau-, Abendrealsch
- Seite 165 und 166:
164 8.6 Berufsoberschulen, Fachober
- Seite 167 und 168:
166 8.8 Studierende an der Fachhoch
- Seite 169 und 170:
168 8.10 Regionale Herkunft der Stu
- Seite 171 und 172:
170 8.12 Themenbereiche, Kurse, Tei
- Seite 173 und 174:
172 8.14 Kartenverkauf, Personal un
- Seite 175 und 176:
174 8.16 Bibliotheken und Bücherei
- Seite 177 und 178:
176 8.18 Sportvereine nach Sportart
- Seite 179 und 180:
DSD Duales System Deutschland Die D
- Seite 181 und 182:
180 9.3 Erfasste Wertstoffe nach Sa
- Seite 183 und 184:
182 9.5 Immissions-Konzentrationsme
- Seite 185 und 186:
Aufklärungsquote Die Aufklärungsq
- Seite 187 und 188:
186 10.2 Erfasste strafbare Handlun
- Seite 189 und 190:
188 10.4 Straßenverkehrsunfälle n
- Seite 191 und 192:
190 10.6 Brandschutzwesen Zahl 1997
- Seite 193 und 194:
192 10.8 Friedhöfe und Krematorien
- Seite 196 und 197:
11 Kommunalfinanzen und Verwaltung
- Seite 198 und 199:
197 11.1 Einnahmen und Ausgaben des
- Seite 200 und 201:
199 11.3 Steuerhebesätze und Steue
- Seite 202 und 203: 201 11.5 Ausgaben im Verwaltungs- u
- Seite 204: 203 11.7 Personal der Stadtverwaltu
- Seite 208 und 209: 207 12.1 Fläche und Bevölkerungss
- Seite 210 und 211: 209 12.3 Wanderungsbewegung Zuzüge
- Seite 212 und 213: 211 12.5 Bevölkerungssaldo insgesa
- Seite 214 und 215: 213 12.7 Fahrzeugbestand Fahrzeugbe
- Seite 216: 13 Städtevergleich Tabellen-Nr. 13
- Seite 219 und 220: 218 13.2 Stadtgebiet nach Nutzungsa
- Seite 221 und 222: 220 13.4 Altersstruktur Stadt Jahr
- Seite 223 und 224: 222 13.6 Wanderungsbewegung Zugezog
- Seite 225 und 226: 224 13.8 Bevölkerungsentwicklung B
- Seite 227 und 228: 226 13.10 Sozialversicherungspflich
- Seite 229 und 230: 228 13.11 Verarbeitendes Gewerbe 1)
- Seite 231 und 232: 230 13.13 Bruttoinlandsprodukt (BIP
- Seite 233 und 234: 232 13.15 Kraftfahrzeuge und Straß
- Seite 235 und 236: 234 13.17 Sozialwesen Sozialhilfe K
- Seite 237 und 238: 236 13.19 Kindergärten und Volkssc
- Seite 239 und 240: 238 13.21 Gesundheitswesen Krankenh
- Seite 241 und 242: 240 13.23 Realsteuergrundbeträge,
- Seite 243 und 244: 242 13.25 Sonstige Steuereinnahmen
- Seite 246: 14 Überregionaler Vergleich Tabell
- Seite 249 und 250: 248 14.2 Altersstruktur G e b i e t
- Seite 251: 250 14.4 Eheschließungen Jahr Rege
- Seite 255 und 256: 254 14.8 Sozialversicherungspflicht
- Seite 257 und 258: 256 14.10 Bruttoinlandsprodukt (BIP
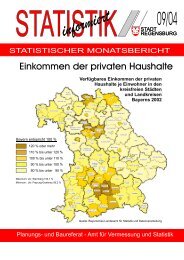
- Seite 259 und 260: 258 14.12 Einkommen der privaten Ha
- Seite 262 und 263: 261 15.1 Witterungsverhältnisse Ja
- Seite 264 und 265: 263 15.3 Arbeitslose und Offene Ste
- Seite 266 und 267: 265 15.5 Sozialversicherungspflicht
- Seite 268 und 269: 267 15.7 Bauhauptgewerbe 1) Beschä
- Seite 270 und 271: 269 15.9 Verkehrswesen Individualve
- Seite 272 und 273: 271 15.11 Krankenhauswesen 1) Krank
- Seite 274 und 275: 273 15.13 Städtische Ver- und Ents
- Seite 276: 275 15.15 Kommunalfinanzen 1) Jahr
- Seite 280 und 281: 279 16.1 Aktuelle Wahlen im Überbl
- Seite 282 und 283: 281 18.06.1989 12.06.1994 13.06.199
- Seite 284 und 285: 283 16.10.1994 27.09.1998 22.09.200
- Seite 286 und 287: 285 16.10.1994 27.09.1998 22.09.200
- Seite 288 und 289: 287 12.10.1986 14.10.1990 25.09.199
- Seite 290 und 291: 289 12.10.1986 14.10.1990 25.09.199
- Seite 292 und 293: 291 12.10.1986 14.10.1990 25.09.199
- Seite 294 und 295: 293 1974 1978 1982 1986 1990 1994 1
- Seite 296 und 297: 295 1974 1978 1982 1986 1990 1994 1
- Seite 298 und 299: 297 1974 1978 1982 1986 1990 1994 1
- Seite 300 und 301: 299 13.03.1966 11.06.1972 05.03.197
- Seite 302:
301 18.03.1990 01.04.1990 11.06.197
- Seite 306 und 307:
Geburten und Sterbefälle in den St
- Seite 308 und 309:
Bevölkerungsentwicklung in den Sta
- Seite 310:
Stichwortverzeichnis y BxZ
- Seite 313 und 314:
312 - im Verarbeitenden Gewerbe 4.3
- Seite 315 und 316:
314 - langfristige Zeitreihe 15.15
- Seite 317 und 318:
316 Minderjährige 2.12 Minderjähr
- Seite 319 und 320:
318 Tatverdächtige nach Straftaten
- Seite 321:
Statistische Monatsberichte (Januar