9-2017
Fachzeitschrift für Hochfrequenz- und Mikrowellentechnik
Fachzeitschrift für Hochfrequenz- und Mikrowellentechnik

Erfolgreiche ePaper selbst erstellen
Machen Sie aus Ihren PDF Publikationen ein blätterbares Flipbook mit unserer einzigartigen Google optimierten e-Paper Software.
RF & Wireless<br />
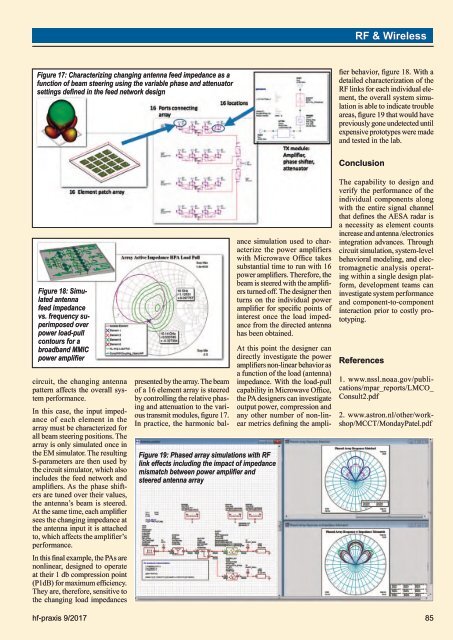
Figure 17: Characterizing changing antenna feed impedance as a<br />
function of beam steering using the variable phase and attenuator<br />
settings defined in the feed network design<br />
At this point the designer can<br />
directly investigate the power<br />
amplifiers non-linear behavior as<br />
a function of the load (antenna)<br />
impedance. With the load-pull<br />
capability in Microwave Office,<br />
the PA designers can investigate<br />
output power, compression and<br />
any other number of non-linear<br />
metrics defining the amplifier<br />
behavior, figure 18. With a<br />
detailed characterization of the<br />
RF links for each individual element,<br />
the overall system simulation<br />
is able to indicate trouble<br />
areas, figure 19 that would have<br />
previously gone undetected until<br />
expensive prototypes were made<br />
and tested in the lab.<br />
Figure 18: Simulated<br />
antenna<br />
feed impedance<br />
vs. frequency superimposed<br />
over<br />
power load-pull<br />
contours for a<br />
broadband MMIC<br />
power amplifier<br />
circuit, the changing antenna<br />
pattern affects the overall system<br />
performance.<br />
In this case, the input impedance<br />
of each element in the<br />
array must be characterized for<br />
all beam steering positions. The<br />
array is only simulated once in<br />
the EM simulator. The resulting<br />
S-parameters are then used by<br />
the circuit simulator, which also<br />
includes the feed network and<br />
amplifiers. As the phase shifters<br />
are tuned over their values,<br />
the antenna’s beam is steered.<br />
At the same time, each amplifier<br />
sees the changing impedance at<br />
the antenna input it is attached<br />
to, which affects the amplifier’s<br />
performance.<br />
In this final example, the PAs are<br />
nonlinear, designed to operate<br />
at their 1 db compression point<br />
(P1dB) for maximum efficiency.<br />
They are, therefore, sensitive to<br />
the changing load impedances<br />
Figure 19: Phased array simulations with RF<br />
link effects including the impact of impedance<br />
mismatch between power amplifier and<br />
steered antenna array<br />
presented by the array. The beam<br />
of a 16 element array is steered<br />
by controlling the relative phasing<br />
and attenuation to the various<br />
transmit modules, figure 17.<br />
In practice, the harmonic balance<br />
simulation used to characterize<br />
the power amplifiers<br />
with Microwave Office takes<br />
substantial time to run with 16<br />
power amplifiers. Therefore, the<br />
beam is steered with the amplifiers<br />
turned off. The designer then<br />
turns on the individual power<br />
amplifier for specific points of<br />
interest once the load impedance<br />
from the directed antenna<br />
has been obtained.<br />
Conclusion<br />
The capability to design and<br />
verify the performance of the<br />
individual components along<br />
with the entire signal channel<br />
that defines the AESA radar is<br />
a necessity as element counts<br />
increase and antenna /electronics<br />
integration advances. Through<br />
circuit simulation, system-level<br />
behavioral modeling, and electromagnetic<br />
analysis operating<br />
within a single design platform,<br />
development teams can<br />
investigate system performance<br />
and component-to-component<br />
interaction prior to costly prototyping.<br />
References<br />
1. www.nssl.noaa.gov/publications/mpar_reports/LMCO_<br />
Consult2.pdf<br />
2. www.astron.nl/other/workshop/MCCT/MondayPatel.pdf<br />
hf-praxis 9/<strong>2017</strong> 85