Optimality
Optimality
Optimality
You also want an ePaper? Increase the reach of your titles
YUMPU automatically turns print PDFs into web optimized ePapers that Google loves.
Regression trees 221<br />
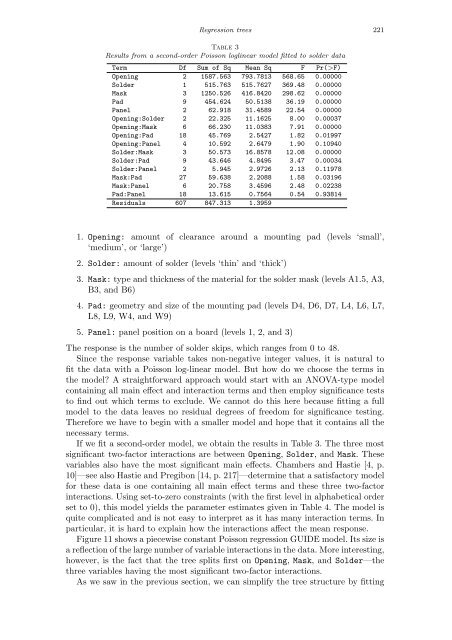
Table 3<br />
Results from a second-order Poisson loglinear model fitted to solder data<br />
Term Df Sum of Sq Mean Sq F Pr(>F)<br />
Opening 2 1587.563 793.7813 568.65 0.00000<br />
Solder 1 515.763 515.7627 369.48 0.00000<br />
Mask 3 1250.526 416.8420 298.62 0.00000<br />
Pad 9 454.624 50.5138 36.19 0.00000<br />
Panel 2 62.918 31.4589 22.54 0.00000<br />
Opening:Solder 2 22.325 11.1625 8.00 0.00037<br />
Opening:Mask 6 66.230 11.0383 7.91 0.00000<br />
Opening:Pad 18 45.769 2.5427 1.82 0.01997<br />
Opening:Panel 4 10.592 2.6479 1.90 0.10940<br />
Solder:Mask 3 50.573 16.8578 12.08 0.00000<br />
Solder:Pad 9 43.646 4.8495 3.47 0.00034<br />
Solder:Panel 2 5.945 2.9726 2.13 0.11978<br />
Mask:Pad 27 59.638 2.2088 1.58 0.03196<br />
Mask:Panel 6 20.758 3.4596 2.48 0.02238<br />
Pad:Panel 18 13.615 0.7564 0.54 0.93814<br />
Residuals 607 847.313 1.3959<br />
1. Opening: amount of clearance around a mounting pad (levels ‘small’,<br />
‘medium’, or ‘large’)<br />
2. Solder: amount of solder (levels ‘thin’ and ‘thick’)<br />
3. Mask: type and thickness of the material for the solder mask (levels A1.5, A3,<br />
B3, and B6)<br />
4. Pad: geometry and size of the mounting pad (levels D4, D6, D7, L4, L6, L7,<br />
L8, L9, W4, and W9)<br />
5. Panel: panel position on a board (levels 1, 2, and 3)<br />
The response is the number of solder skips, which ranges from 0 to 48.<br />
Since the response variable takes non-negative integer values, it is natural to<br />
fit the data with a Poisson log-linear model. But how do we choose the terms in<br />
the model? A straightforward approach would start with an ANOVA-type model<br />
containing all main effect and interaction terms and then employ significance tests<br />
to find out which terms to exclude. We cannot do this here because fitting a full<br />
model to the data leaves no residual degrees of freedom for significance testing.<br />
Therefore we have to begin with a smaller model and hope that it contains all the<br />
necessary terms.<br />
If we fit a second-order model, we obtain the results in Table 3. The three most<br />
significant two-factor interactions are between Opening, Solder, and Mask. These<br />
variables also have the most significant main effects. Chambers and Hastie [4, p.<br />
10]—see also Hastie and Pregibon [14, p. 217]—determine that a satisfactory model<br />
for these data is one containing all main effect terms and these three two-factor<br />
interactions. Using set-to-zero constraints (with the first level in alphabetical order<br />
set to 0), this model yields the parameter estimates given in Table 4. The model is<br />
quite complicated and is not easy to interpret as it has many interaction terms. In<br />
particular, it is hard to explain how the interactions affect the mean response.<br />
Figure 11 shows a piecewise constant Poisson regression GUIDE model. Its size is<br />
a reflection of the large number of variable interactions in the data. More interesting,<br />
however, is the fact that the tree splits first on Opening, Mask, and Solder—the<br />
three variables having the most significant two-factor interactions.<br />
As we saw in the previous section, we can simplify the tree structure by fitting


