

Optimality
Optimality
Optimality

Create successful ePaper yourself
Turn your PDF publications into a flip-book with our unique Google optimized e-Paper software.
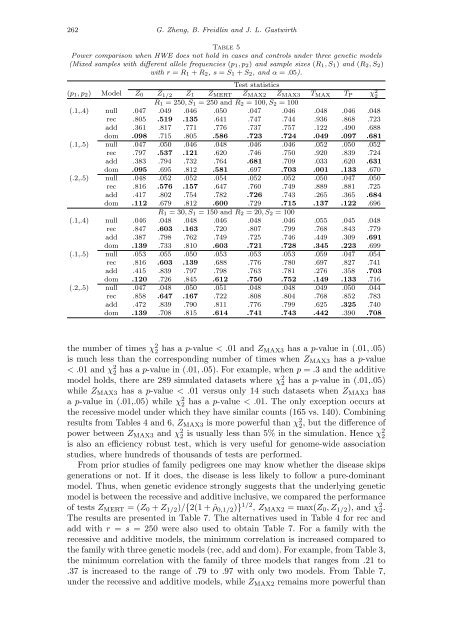
262 G. Zheng, B. Freidlin and J. L. Gastwirth<br />
Table 5<br />
Power comparison when HWE does not hold in cases and controls under three genetic models<br />
(Mixed samples with different allele frequencies (p1, p2) and sample sizes (R1, S1) and (R2, S2)<br />
with r = R1 + R2, s = S1 + S2, and α = .05).<br />
Test statistics<br />
(p1, p2) Model Z0 Z 1/2 Z1 ZMERT ZMAX2 ZMAX3 TMAX TP χ 2 2<br />
R1 = 250, S1 = 250 and R2 = 100, S2 = 100<br />
(.1,.4) null .047 .049 .046 .050 .047 .046 .048 .046 .048<br />
rec .805 .519 .135 .641 .747 .744 .936 .868 .723<br />
add .361 .817 .771 .776 .737 .757 .122 .490 .688<br />
dom .098 .715 .805 .586 .723 .724 .049 .097 .681<br />
(.1,.5) null .047 .050 .046 .048 .046 .046 .052 .050 .052<br />
rec .797 .537 .121 .620 .746 .750 .920 .839 .724<br />
add .383 .794 .732 .764 .681 .709 .033 .620 .631<br />
dom .095 .695 .812 .581 .697 .703 .001 .133 .670<br />
(.2,.5) null .048 .052 .052 .054 .052 .052 .050 .047 .050<br />
rec .816 .576 .157 .647 .760 .749 .889 .881 .725<br />
add .417 .802 .754 .782 .726 .743 .265 .365 .684<br />
dom .112 .679 .812 .600 .729 .715 .137 .122 .696<br />
R1 = 30, S1 = 150 and R2 = 20, S2 = 100<br />
(.1,.4) null .046 .048 .048 .046 .048 .046 .055 .045 .048<br />
rec .847 .603 .163 .720 .807 .799 .768 .843 .779<br />
add .387 .798 .762 .749 .725 .746 .449 .309 .691<br />
dom .139 .733 .810 .603 .721 .728 .345 .223 .699<br />
(.1,.5) null .053 .055 .050 .053 .053 .053 .059 .047 .054<br />
rec .816 .603 .139 .688 .776 .780 .697 .827 .741<br />
add .415 .839 .797 .798 .763 .781 .276 .358 .703<br />
dom .120 .726 .845 .612 .750 .752 .149 .133 .716<br />
(.2,.5) null .047 .048 .050 .051 .048 .048 .049 .050 .044<br />
rec .858 .647 .167 .722 .808 .804 .768 .852 .783<br />
add .472 .839 .790 .811 .776 .799 .625 .325 .740<br />
dom .139 .708 .815 .614 .741 .743 .442 .390 .708<br />
the number of times χ 2 2 has a p-value < .01 and ZMAX3 has a p-value in (.01, .05)<br />
is much less than the corresponding number of times when ZMAX3 has a p-value<br />
< .01 and χ 2 2 has a p-value in (.01, .05). For example, when p = .3 and the additive<br />
model holds, there are 289 simulated datasets where χ 2 2 has a p-value in (.01,.05)<br />
while ZMAX3 has a p-value < .01 versus only 14 such datasets when ZMAX3 has<br />
a p-value in (.01,.05) while χ 2 2 has a p-value < .01. The only exception occurs at<br />
the recessive model under which they have similar counts (165 vs. 140). Combining<br />
results from Tables 4 and 6, ZMAX3 is more powerful than χ 2 2, but the difference of<br />
power between ZMAX3 and χ 2 2 is usually less than 5% in the simulation. Hence χ 2 2<br />
is also an efficiency robust test, which is very useful for genome-wide association<br />
studies, where hundreds of thousands of tests are performed.<br />
From prior studies of family pedigrees one may know whether the disease skips<br />
generations or not. If it does, the disease is less likely to follow a pure-dominant<br />
model. Thus, when genetic evidence strongly suggests that the underlying genetic<br />
model is between the recessive and additive inclusive, we compared the performance<br />
of tests ZMERT = (Z0 + Z 1/2)/{2(1 + ˆρ 0,1/2)} 1/2 , ZMAX2 = max(Z0, Z 1/2), and χ 2 2.<br />
The results are presented in Table 7. The alternatives used in Table 4 for rec and<br />
add with r = s = 250 were also used to obtain Table 7. For a family with the<br />
recessive and additive models, the minimum correlation is increased compared to<br />
the family with three genetic models (rec, add and dom). For example, from Table 3,<br />
the minimum correlation with the family of three models that ranges from .21 to<br />
.37 is increased to the range of .79 to .97 with only two models. From Table 7,<br />
under the recessive and additive models, while ZMAX2 remains more powerful than


