

Optimality
Optimality
Optimality

You also want an ePaper? Increase the reach of your titles
YUMPU automatically turns print PDFs into web optimized ePapers that Google loves.
74 C. Cheng<br />
Table 3<br />
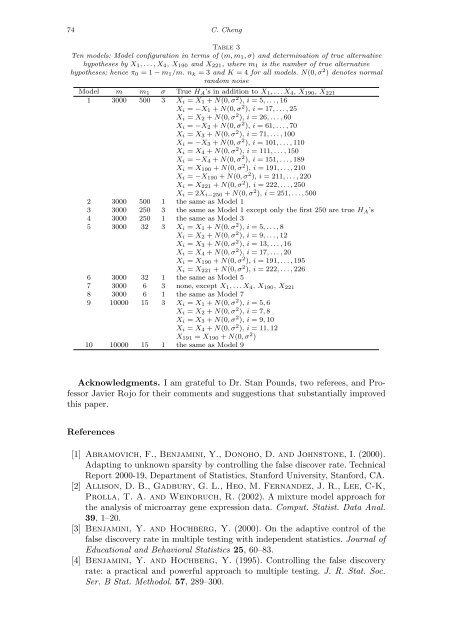
Ten models: Model configuration in terms of (m, m1, σ) and determination of true alternative<br />
hypotheses by X1, . . . , X4, X190 and X221, where m1 is the number of true alternative<br />
hypotheses; hence π0 = 1 − m1/m. nk = 3 and K = 4 for all models. N(0, σ 2 ) denotes normal<br />
random noise<br />
Model m m1 σ True HA’s in addition to X1, . . . X4, X190, X221<br />
1 3000 500 3 Xi = X1 + N(0, σ 2 ), i = 5, . . . , 16<br />
Xi = −X1 + N(0, σ 2 ), i = 17, . . . , 25<br />
Xi = X2 + N(0, σ 2 ), i = 26, . . . , 60<br />
Xi = −X2 + N(0, σ 2 ), i = 61, . . . , 70<br />
Xi = X3 + N(0, σ 2 ), i = 71, . . . , 100<br />
Xi = −X3 + N(0, σ 2 ), i = 101, . . . , 110<br />
Xi = X4 + N(0, σ 2 ), i = 111, . . . , 150<br />
Xi = −X4 + N(0, σ 2 ), i = 151, . . . , 189<br />
Xi = X190 + N(0, σ 2 ), i = 191, . . . , 210<br />
Xi = −X190 + N(0, σ 2 ), i = 211, . . . , 220<br />
Xi = X221 + N(0, σ 2 ), i = 222, . . . , 250<br />
Xi = 2Xi−250 + N(0, σ 2 ), i = 251, . . . , 500<br />
2 3000 500 1 the same as Model 1<br />
3 3000 250 3 the same as Model 1 except only the first 250 are true HA’s<br />
4 3000 250 1 the same as Model 3<br />
5 3000 32 3 Xi = X1 + N(0, σ 2 ), i = 5, . . . , 8<br />
Xi = X2 + N(0, σ 2 ), i = 9, . . . , 12<br />
Xi = X3 + N(0, σ 2 ), i = 13, . . . , 16<br />
Xi = X4 + N(0, σ 2 ), i = 17, . . . , 20<br />
Xi = X190 + N(0, σ 2 ), i = 191, . . . , 195<br />
Xi = X221 + N(0, σ 2 ), i = 222, . . . , 226<br />
6 3000 32 1 the same as Model 5<br />
7 3000 6 3 none, except X1, . . . X4, X190, X221<br />
8 3000 6 1 the same as Model 7<br />
9 10000 15 3 Xi = X1 + N(0, σ 2 ), i = 5, 6<br />
Xi = X2 + N(0, σ 2 ), i = 7, 8<br />
Xi = X3 + N(0, σ 2 ), i = 9, 10<br />
Xi = X4 + N(0, σ 2 ), i = 11, 12<br />
X191 = X190 + N(0, σ 2 )<br />
10 10000 15 1 the same as Model 9<br />
Acknowledgments. I am grateful to Dr. Stan Pounds, two referees, and Professor<br />
Javier Rojo for their comments and suggestions that substantially improved<br />
this paper.<br />
References<br />
[1] Abramovich, F., Benjamini, Y., Donoho, D. and Johnstone, I. (2000).<br />
Adapting to unknown sparsity by controlling the false discover rate. Technical<br />
Report 2000-19, Department of Statistics, Stanford University, Stanford, CA.<br />
[2] Allison, D. B., Gadbury, G. L., Heo, M. Fernandez, J. R., Lee, C-K,<br />
Prolla, T. A. and Weindruch, R. (2002). A mixture model approach for<br />
the analysis of microarray gene expression data. Comput. Statist. Data Anal.<br />
39, 1–20.<br />
[3] Benjamini, Y. and Hochberg, Y. (2000). On the adaptive control of the<br />
false discovery rate in multiple testing with independent statistics. Journal of<br />
Educational and Behavioral Statistics 25, 60–83.<br />
[4] Benjamini, Y. and Hochberg, Y. (1995). Controlling the false discovery<br />
rate: a practical and powerful approach to multiple testing. J. R. Stat. Soc.<br />
Ser. B Stat. Methodol. 57, 289–300.


