Petaluma Bombing Target Archive Search Report ... - Corpsfuds.org
Petaluma Bombing Target Archive Search Report ... - Corpsfuds.org
Petaluma Bombing Target Archive Search Report ... - Corpsfuds.org

Create successful ePaper yourself
Turn your PDF publications into a flip-book with our unique Google optimized e-Paper software.
Month<br />
November<br />
December<br />
Average<br />
ARCHIVES SEARCH REPORT - FINDINGS<br />
<strong>Petaluma</strong> 12th Naval District <strong>Target</strong> No. 9<br />
<strong>Petaluma</strong>, CA<br />
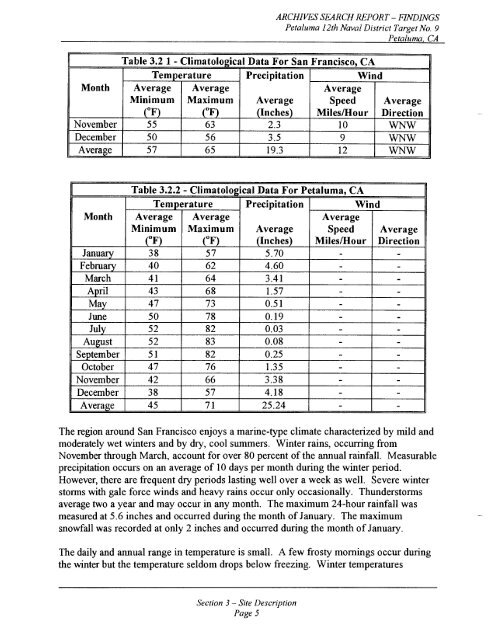
Table 3.2 1 - Climatological Data For San Francisco, CA<br />
Temperature Precipitation<br />
Wind<br />
Average Average<br />
Average<br />
Minimum Maximum Average Speed Average<br />
(OF)<br />
55<br />
(OF)<br />
63<br />
(Inches)<br />
2.3<br />
Miles/Hour<br />
10<br />
Direction<br />
WNW<br />
50 56 3.5<br />
9 WNW<br />
57 65 19.3<br />
12 WNW<br />
Table 3.2.2 - Climatolo~ical Data For <strong>Petaluma</strong>. CA<br />
Temperature Precipitation Wind<br />
Month Average Average<br />
Average<br />
Minimum Maximum Average Speed Average<br />
January<br />
February<br />
March<br />
April 1<br />
May<br />
June<br />
July<br />
August<br />
September<br />
October<br />
November 1<br />
December<br />
Average<br />
(OF)<br />
38<br />
40<br />
41<br />
43<br />
47<br />
50<br />
52<br />
52<br />
5 1<br />
47<br />
42<br />
38<br />
45<br />
1<br />
1<br />
(OF)<br />
57<br />
62<br />
64<br />
68<br />
73<br />
7 8<br />
82<br />
8 3<br />
8 2<br />
76<br />
66<br />
57<br />
71<br />
1<br />
1<br />
(Inches)<br />
5.70<br />
4.60<br />
3.41<br />
1.57<br />
0.5 1<br />
0.19<br />
0.03<br />
0.08<br />
0.25<br />
1.35<br />
3.38<br />
4.18<br />
25.24<br />
Miles/Hour Direction<br />
-<br />
-<br />
-<br />
-<br />
-<br />
-<br />
I - I -<br />
-<br />
-<br />
-<br />
-<br />
-<br />
-<br />
-<br />
-<br />
-<br />
-<br />
-<br />
-<br />
I - I -<br />
-<br />
-<br />
-<br />
-<br />
The region around San Francisco enjoys a marine-type climate characterized by mild and<br />
moderately wet winters and by dry, cool summers. Winter rains, occurring from<br />
November through March, account for over 80 percent of the annual rainfall. Measurable<br />
precipitation occurs on an average of 10 days per month during the winter period.<br />
However, there are frequent dry periods lasting well over a week as well. Severe winter<br />
storms with gale force winds and heavy rains occur only occasionally. Thunderstorms<br />
average two a year and may occur in any month. The maximum 24-hour rainfall was<br />
measured at 5.6 inches and occurred during the month of January. The maximum<br />
snowfall was recorded at only 2 inches and occurred during the month of January.<br />
The daily and annual range in temperature is small. A few frosty mornings occur during<br />
the winter but the temperature seldom drops below freezing. Winter temperatures<br />
Section 3 - Site Description<br />
Page 5