Letaba Biomass to Energy PDD - MyClimate
Letaba Biomass to Energy PDD - MyClimate
Letaba Biomass to Energy PDD - MyClimate
You also want an ePaper? Increase the reach of your titles
YUMPU automatically turns print PDFs into web optimized ePapers that Google loves.
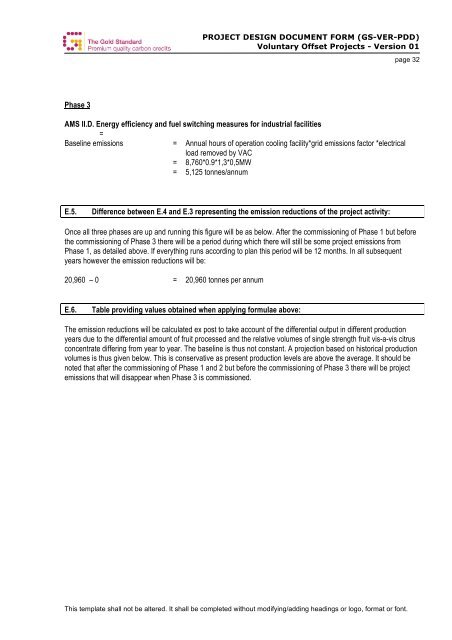
Phase 3<br />
PROJECT DESIGN DOCUMENT FORM (GS-VER-<strong>PDD</strong>)<br />
Voluntary Offset Projects - Version 01<br />
AMS II.D. <strong>Energy</strong> efficiency and fuel switching measures for industrial facilities<br />
=<br />
Baseline emissions = Annual hours of operation cooling facility*grid emissions fac<strong>to</strong>r *electrical<br />
load removed by VAC<br />
= 8,760*0.9*1,3*0,5MW<br />
= 5,125 <strong>to</strong>nnes/annum<br />
E.5. Difference between E.4 and E.3 representing the emission reductions of the project activity:<br />
This template shall not be altered. It shall be completed without modifying/adding headings or logo, format or font.<br />
page 32<br />
Once all three phases are up and running this figure will be as below. After the commissioning of Phase 1 but before<br />
the commissioning of Phase 3 there will be a period during which there will still be some project emissions from<br />
Phase 1, as detailed above. If everything runs according <strong>to</strong> plan this period will be 12 months. In all subsequent<br />
years however the emission reductions will be:<br />
20,960 – 0 = 20,960 <strong>to</strong>nnes per annum<br />
E.6. Table providing values obtained when applying formulae above:<br />
The emission reductions will be calculated ex post <strong>to</strong> take account of the differential output in different production<br />
years due <strong>to</strong> the differential amount of fruit processed and the relative volumes of single strength fruit vis-a-vis citrus<br />
concentrate differing from year <strong>to</strong> year. The baseline is thus not constant. A projection based on his<strong>to</strong>rical production<br />
volumes is thus given below. This is conservative as present production levels are above the average. It should be<br />
noted that after the commissioning of Phase 1 and 2 but before the commissioning of Phase 3 there will be project<br />
emissions that will disappear when Phase 3 is commissioned.


