Quarterly Report 1/2009 - Munich Re Group
Quarterly Report 1/2009 - Munich Re Group
Quarterly Report 1/2009 - Munich Re Group

Create successful ePaper yourself
Turn your PDF publications into a flip-book with our unique Google optimized e-Paper software.
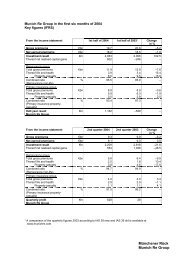
Interim management report Business experience<br />
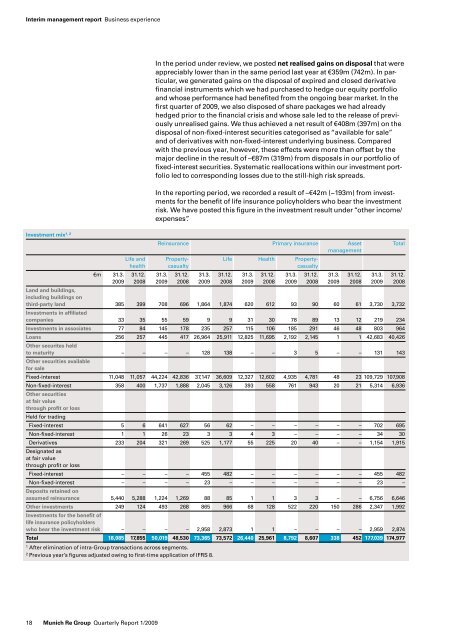
Investment mix1, 2<br />
1 After elimination of intra-<strong>Group</strong> transactions across segments.<br />
2 Previous year’s figures adjusted owing to first-time application of IFRS 8.<br />
18 <strong>Munich</strong> <strong>Re</strong> <strong>Group</strong> <strong>Quarterly</strong> <strong><strong>Re</strong>port</strong> 1/<strong>2009</strong><br />
In the period under review, we posted net realised gains on disposal that were<br />
appreciably lower than in the same period last year at €359m (742m). In particular,<br />
we generated gains on the disposal of expired and closed derivative<br />
financial instruments which we had purchased to hedge our equity portfolio<br />
and whose performance had benefited from the ongoing bear market. In the<br />
first quarter of <strong>2009</strong>, we also disposed of share packages we had already<br />
hedged prior to the financial crisis and whose sale led to the release of previously<br />
unrealised gains. We thus achieved a net result of €408m (397m) on the<br />
disposal of non-fixed-interest securities categorised as “available for sale”<br />
and of derivatives with non-fixed-interest underlying business. Compared<br />
with the previous year, however, these effects were more than offset by the<br />
major decline in the result of –€87m (319m) from disposals in our portfolio of<br />
fixed-interest securities. Systematic reallocations within our investment portfolio<br />
led to corresponding losses due to the still-high risk spreads.<br />
In the reporting period, we recorded a result of –€42m (−193m) from investments<br />
for the benefit of life insurance policyholders who bear the investment<br />
risk. We have posted this figure in the investment result under “other income/<br />
expenses”.<br />
<strong>Re</strong>insurance Primary insurance Asset Total<br />
management<br />
Life and Property- Life Health Property-<br />
health casualty casualty<br />
€m 31.3. 31.12. 31.3. 31.12. 31.3. 31.12. 31.3. 31.12. 31.3. 31.12. 31.3. 31.12. 31.3. 31.12.<br />
<strong>2009</strong> 2008 <strong>2009</strong> 2008 <strong>2009</strong> 2008 <strong>2009</strong> 2008 <strong>2009</strong> 2008 <strong>2009</strong> 2008 <strong>2009</strong> 2008<br />
Land and buildings,<br />
including buildings on<br />
third-party land<br />
Investments in affiliated<br />
385 399 708 696 1,864 1,874 620 612 93 90 60 61 3,730 3,732<br />
companies 33 35 55 59 9 9 31 30 78 89 13 12 219 234<br />
Investments in associates 77 84 145 178 235 257 115 106 185 291 46 48 803 964<br />
Loans<br />
Other securites held<br />
256 257 445 417 26,964 25,911 12,825 11,695 2,192 2,145 1 1 42,683 40,426<br />
to maturity<br />
Other securities available<br />
for sale<br />
– – – – 128 138 – – 3 5 – – 131 143<br />
Fixed-interest 11,048 11,057 44,224 42,836 37,147 36,609 12,327 12,602 4,935 4,781 48 23 109,729 107,908<br />
Non-fixed-interest<br />
Other securities<br />
at fair value<br />
through profit or loss<br />
Held for trading<br />
358 400 1,737 1,888 2,045 3,126 393 558 761 943 20 21 5,314 6,936<br />
Fixed-interest 5 6 641 627 56 62 – – – – – – 702 695<br />
Non-fixed-interest 1 1 26 23 3 3 4 3 – – – – 34 30<br />
Derivatives<br />
Designated as<br />
at fair value<br />
through profit or loss<br />
233 204 321 269 525 1,177 55 225 20 40 – – 1,154 1,915<br />
Fixed-interest – – – – 455 482 – – – – – – 455 482<br />
Non-fixed-interest<br />
Deposits retained on<br />
– – – – 23 – – – – – – – 23 –<br />
assumed reinsurance 5,440 5,288 1,224 1,269 88 85 1 1 3 3 – – 6,756 6,646<br />
Other investments 249 124 493 268 865 966 68 128 522 220 150 286 2,347 1,992<br />
Investments for the benefit of<br />
life insurance policyholders<br />
who bear the investment risk – – – – 2,958 2,873 1 1 – – – – 2,959 2,874<br />
Total 18,085 17,855 50,019 48,530 73,365 73,572 26,440 25,961 8,792 8,607 338 452 177,039 174,977