Quarterly Report 1/2009 - Munich Re Group
Quarterly Report 1/2009 - Munich Re Group
Quarterly Report 1/2009 - Munich Re Group

Create successful ePaper yourself
Turn your PDF publications into a flip-book with our unique Google optimized e-Paper software.
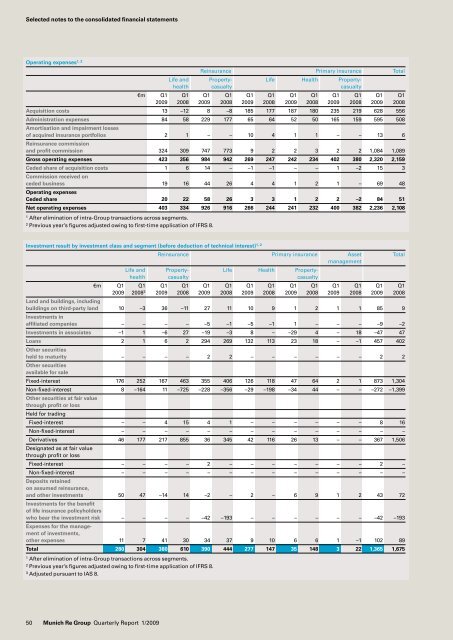
Selected notes to the consolidated financial statements<br />
Operating expenses1, 2<br />
1 After elimination of intra<strong>Group</strong> transactions across segments.<br />
2 Previous year’s figures adjusted owing to firsttime application of IFRS 8.<br />
1 After elimination of intra<strong>Group</strong> transactions across segments.<br />
2 Previous year’s figures adjusted owing to firsttime application of IFRS 8.<br />
3 Adjusted pursuant to IAS 8.<br />
50 <strong>Munich</strong> <strong>Re</strong> <strong>Group</strong> <strong>Quarterly</strong> <strong><strong>Re</strong>port</strong> 1/<strong>2009</strong><br />
<strong>Re</strong>insurance Primary insurance Total<br />
Life and Property Life Health Property<br />
health casualty casualty<br />
€m Q1 Q1 Q1 Q1 Q1 Q1 Q1 Q1 Q1 Q1 Q1 Q1<br />
<strong>2009</strong> 2008 <strong>2009</strong> 2008 <strong>2009</strong> 2008 <strong>2009</strong> 2008 <strong>2009</strong> 2008 <strong>2009</strong> 2008<br />
Acquisition costs 13 –12 8 –8 185 177 187 180 235 219 628 556<br />
Administration expenses 84 58 229 177 65 64 52 50 165 159 595 508<br />
Amortisation and impairment losses<br />
of acquired insurance portfolios<br />
<strong>Re</strong>insurance commission<br />
2 1 – – 10 4 1 1 – – 13 6<br />
and profit commission 324 309 747 773 9 2 2 3 2 2 1,084 1,089<br />
Gross operating expenses 423 356 984 942 269 247 242 234 402 380 2,320 2,159<br />
Ceded share of acquisition costs<br />
Commission received on<br />
1 6 14 – –1 –1 – – 1 –2 15 3<br />
ceded business<br />
Operating expenses<br />
19 16 44 26 4 4 1 2 1 – 69 48<br />
Ceded share 20 22 58 26 3 3 1 2 2 –2 84 51<br />
Net operating expenses 403 334 926 916 266 244 241 232 400 382 2,236 2,108<br />
Investment result by investment class and segment (before deduction of technical interest) 1, 2<br />
<strong>Re</strong>insurance Primary insurance Asset Total<br />
management<br />
Life and Property Life Health Property<br />
health casualty casualty<br />
€m Q1 Q1 Q1 Q1 Q1 Q1 Q1 Q1 Q1 Q1 Q1 Q1 Q1 Q1<br />
<strong>2009</strong> 2008 3 <strong>2009</strong> 2008 <strong>2009</strong> 2008 <strong>2009</strong> 2008 <strong>2009</strong> 2008 <strong>2009</strong> 2008 <strong>2009</strong> 2008<br />
Land and buildings, including<br />
buildings on third-party land<br />
Investments in<br />
10 –3 36 –11 27 11 10 9 1 2 1 1 85 9<br />
affiliated companies – – – – –5 –1 –5 –1 1 – – – –9 –2<br />
Investments in associates –1 1 –6 27 –19 –3 8 – –29 4 – 18 –47 47<br />
Loans<br />
Other securities<br />
2 1 6 2 294 269 132 113 23 18 – –1 457 402<br />
held to maturity<br />
Other securities<br />
available for sale<br />
– – – – 2 2 – – – – – – 2 2<br />
Fixedinterest 176 252 167 463 355 406 126 118 47 64 2 1 873 1,304<br />
Non-fixed-interest<br />
Other securities at fair value<br />
through profit or loss<br />
Held for trading<br />
8 –164 11 –725 –228 –356 –29 –198 –34 44 – – –272 –1,399<br />
Fixedinterest – – 4 15 4 1 – – – – – – 8 16<br />
Non-fixed-interest – – – – – – – – – – – – – –<br />
Derivatives<br />
Designated as at fair value<br />
through profit or loss<br />
46 177 217 855 36 345 42 116 26 13 – – 367 1,506<br />
Fixedinterest – – – – 2 – – – – – – – 2 –<br />
Non-fixed-interest<br />
Deposits retained<br />
on assumed reinsurance,<br />
– – – – – – – – – – – – – –<br />
and other investments<br />
Investments for the benefit<br />
50 47 –14 14 –2 – 2 – 6 9 1 2 43 72<br />
of life insurance policyholders<br />
who bear the investment risk<br />
Expenses for the management<br />
of investments,<br />
– – – – –42 –193 – – – – – – –42 –193<br />
other expenses 11 7 41 30 34 37 9 10 6 6 1 –1 102 89<br />
Total 280 304 380 610 390 444 277 147 35 148 3 22 1,365 1,675