Quarterly Report 1/2009 - Munich Re Group
Quarterly Report 1/2009 - Munich Re Group
Quarterly Report 1/2009 - Munich Re Group

Create successful ePaper yourself
Turn your PDF publications into a flip-book with our unique Google optimized e-Paper software.
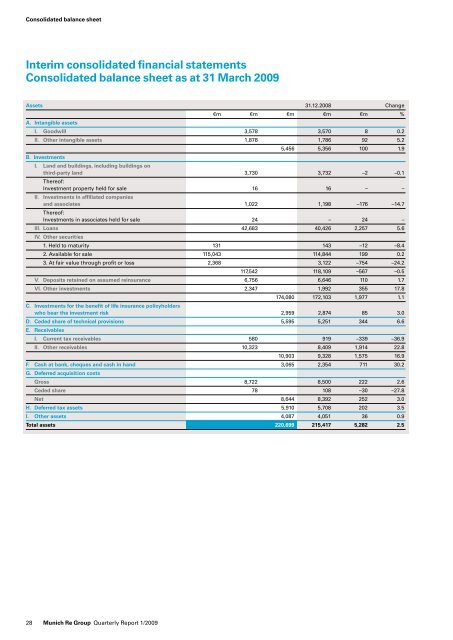
Consolidated balance sheet<br />
Interim consolidated financial statements<br />
Consolidated balance sheet as at 31 March <strong>2009</strong><br />
Assets 31.12.2008 Change<br />
A. Intangible assets<br />
28 <strong>Munich</strong> <strong>Re</strong> <strong>Group</strong> <strong>Quarterly</strong> <strong><strong>Re</strong>port</strong> 1/<strong>2009</strong><br />
€m €m €m €m €m %<br />
I. Goodwill 3,578 3,570 8 0.2<br />
II. Other intangible assets 1,878 1,786 92 5.2<br />
B. Investments<br />
5,456 5,356 100 1.9<br />
I. Land and buildings, including buildings on<br />
third-party land 3,730 3,732 –2 –0.1<br />
Thereof:<br />
Investment property held for sale 16 16 – –<br />
II. Investments in affiliated companies<br />
and associates<br />
Thereof:<br />
1,022 1,198 –176 –14.7<br />
Investments in associates held for sale 24 – 24 –<br />
III. Loans<br />
IV. Other securities<br />
42,683 40,426 2,257 5.6<br />
1. Held to maturity 131 143 –12 –8.4<br />
2. Available for sale 115,043 114,844 199 0.2<br />
3. At fair value through profit or loss 2,368 3,122 –754 –24.2<br />
117,542 118,109 –567 –0.5<br />
V. Deposits retained on assumed reinsurance 6,756 6,646 110 1.7<br />
VI. Other investments 2,347 1,992 355 17.8<br />
174,080 172,103 1,977 1.1<br />
C. Investments for the benefit of life insurance policyholders<br />
who bear the investment risk 2,959 2,874 85 3.0<br />
D. Ceded share of technical provisions<br />
E. <strong>Re</strong>ceivables<br />
5,595 5,251 344 6.6<br />
I. Current tax receivables 580 919 –339 –36.9<br />
II. Other receivables 10,323 8,409 1,914 22.8<br />
10,903 9,328 1,575 16.9<br />
F. Cash at bank, cheques and cash in hand<br />
G. Deferred acquisition costs<br />
3,065 2,354 711 30.2<br />
Gross 8,722 8,500 222 2.6<br />
Ceded share 78 108 –30 –27.8<br />
Net 8,644 8,392 252 3.0<br />
H. Deferred tax assets 5,910 5,708 202 3.5<br />
I. Other assets 4,087 4,051 36 0.9<br />
Total assets 220,699 215,417 5,282 2.5