TROUBLED WATERS - Whale and Dolphin Conservation Society
TROUBLED WATERS - Whale and Dolphin Conservation Society
TROUBLED WATERS - Whale and Dolphin Conservation Society

Create successful ePaper yourself
Turn your PDF publications into a flip-book with our unique Google optimized e-Paper software.
66<br />
A REVIEW OF THE WELFARE IMPLICATIONS OF MODERN WHALING ACTIVITIES<br />
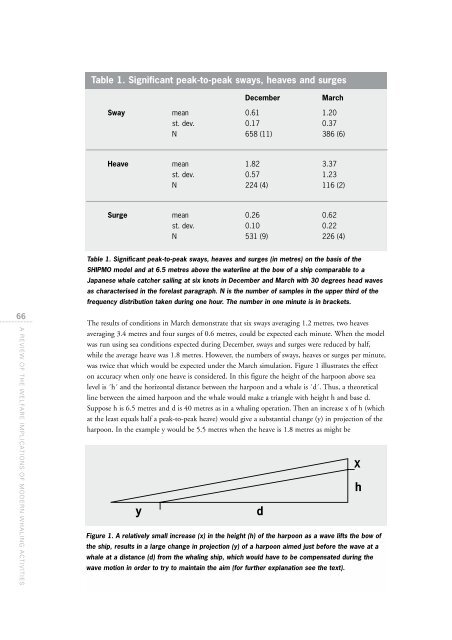
Table 1. Significant peak-to-peak sways, heaves <strong>and</strong> surges<br />
December March<br />
Sway mean 0.61 1.20<br />
st. dev. 0.17 0.37<br />
N 658 (11) 386 (6)<br />
Heave mean 1.82 3.37<br />
st. dev. 0.57 1.23<br />
N 224 (4) 116 (2)<br />
Surge mean 0.26 0.62<br />
st. dev. 0.10 0.22<br />
N 531 (9) 226 (4)<br />
Table 1. Significant peak-to-peak sways, heaves <strong>and</strong> surges (in metres) on the basis of the<br />
SHIPMO model <strong>and</strong> at 6.5 metres above the waterline at the bow of a ship comparable to a<br />
Japanese whale catcher sailing at six knots in December <strong>and</strong> March with 30 degrees head waves<br />
as characterised in the forelast paragraph. N is the number of samples in the upper third of the<br />
frequency distribution taken during one hour. The number in one minute is in brackets.<br />
The results of conditions in March demonstrate that six sways averaging 1.2 metres, two heaves<br />
averaging 3.4 metres <strong>and</strong> four surges of 0.6 metres, could be expected each minute. When the model<br />
was run using sea conditions expected during December, sways <strong>and</strong> surges were reduced by half,<br />
while the average heave was 1.8 metres. However, the numbers of sways, heaves or surges per minute,<br />
was twice that which would be expected under the March simulation. Figure 1 illustrates the effect<br />
on accuracy when only one heave is considered. In this figure the height of the harpoon above sea<br />
level is ´h´ <strong>and</strong> the horizontal distance between the harpoon <strong>and</strong> a whale is ´d´. Thus, a theoretical<br />
line between the aimed harpoon <strong>and</strong> the whale would make a triangle with height h <strong>and</strong> base d.<br />
Suppose h is 6.5 metres <strong>and</strong> d is 40 metres as in a whaling operation. Then an increase x of h (which<br />
at the least equals half a peak-to-peak heave) would give a substantial change (y) in projection of the<br />
harpoon. In the example y would be 5.5 metres when the heave is 1.8 metres as might be<br />
y<br />
Figure 1. A relatively small increase (x) in the height (h) of the harpoon as a wave lifts the bow of<br />
the ship, results in a large change in projection (y) of a harpoon aimed just before the wave at a<br />
whale at a distance (d) from the whaling ship, which would have to be compensated during the<br />
wave motion in order to try to maintain the aim (for further explanation see the text).<br />
d<br />
X<br />
h