Underpinnings of fire management for biodiversity conservation in ...
Underpinnings of fire management for biodiversity conservation in ...
Underpinnings of fire management for biodiversity conservation in ...

Create successful ePaper yourself
Turn your PDF publications into a flip-book with our unique Google optimized e-Paper software.
Litter fuel load (t/ha)<br />
20<br />
18<br />
16<br />
14<br />
12<br />
10<br />
8<br />
6<br />
4<br />
2<br />
<strong>Underp<strong>in</strong>n<strong>in</strong>gs</strong> <strong>of</strong> <strong>fire</strong> <strong>management</strong> <strong>for</strong> <strong>biodiversity</strong> <strong>conservation</strong> <strong>in</strong> reserves<br />
0<br />
0 5 10 15 20<br />
Time s<strong>in</strong>ce <strong>fire</strong> (years)<br />
No residue<br />
14t/ha residue<br />
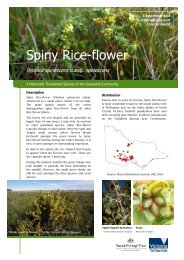
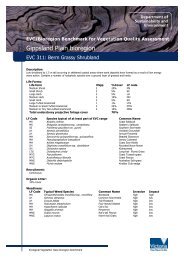
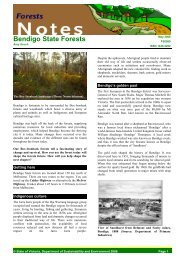
Figure 3.1 F<strong>in</strong>e-litter fuel load as a function <strong>of</strong> time s<strong>in</strong>ce <strong>fire</strong> <strong>in</strong> E. marg<strong>in</strong>ata (Jarrah) <strong>for</strong>est (parameters with zero remnant fuel<br />
from Walker 1981 us<strong>in</strong>g data <strong>of</strong> G. Peet). The complete removal <strong>of</strong> fuel by prescribed <strong>fire</strong> (Equation 3.1 with W max as 18 t ha -1 ,<br />
a as 1 and k as 0.2) is contrasted with the illustrative circumstances <strong>in</strong> which 14 t ha -1 rema<strong>in</strong>s (equation as previously, except a<br />
is 0.222) – see the <strong>in</strong>tercept on the Y-axis.<br />
In Figure 3.1, the classic curve <strong>of</strong> Olson (1963) is contrasted with the situation <strong>in</strong> which some fuel<br />
persists, or is generated, immediately follow<strong>in</strong>g the <strong>fire</strong> (O’Connell 1987). If large quantities <strong>of</strong> fuel<br />
rema<strong>in</strong>, then the effectiveness <strong>of</strong> prescribed burn<strong>in</strong>g <strong>for</strong> fuel reduction would be questioned. For<br />
example, <strong>in</strong> Figure 3.1, a hypothetical illustration only, an average <strong>of</strong> 14 t ha -1 rema<strong>in</strong>s. This may not<br />
be considered to be a satisfactory result <strong>for</strong> fuel reduction per se. In practice, k varies considerably:<br />
Raison et al. (1983) found values between 0.11 and 0.31; Walker (1981) found values from 0.2 to<br />
0.43; and Cary and Gold<strong>in</strong>g (2002) found k to vary from 0.03 to 1.<br />
The <strong>for</strong>m <strong>of</strong> the graphs given by Equations 3.1 and 3.2 <strong>for</strong> fuel measures aga<strong>in</strong>st time s<strong>in</strong>ce <strong>fire</strong><br />
can be applied to all components <strong>of</strong> the fuel array <strong>in</strong> a <strong>for</strong>est, albeit with different parameters (see<br />
Appendix 2 <strong>in</strong> Gould et al. 2007). However, some <strong>of</strong> these components are likely to be unaffected by<br />
prescribed <strong>fire</strong> and variously affected by different <strong>in</strong>tensities <strong>of</strong> unplanned <strong>fire</strong>. For example, Gould et<br />
al. (2007, p. 132) assumed – <strong>in</strong> develop<strong>in</strong>g a <strong>fire</strong>brand model – that ‘elevated and bark fuel are not<br />
consumed at <strong>fire</strong> <strong>in</strong>tensities less than 1000 kW m -1 ’. The effectiveness <strong>of</strong> prescribed burn<strong>in</strong>g <strong>for</strong> the<br />
modification <strong>of</strong> fuels only, is considered further <strong>in</strong> the next section.<br />
Effectiveness <strong>of</strong> prescribed burn<strong>in</strong>g <strong>for</strong> fuel modification<br />
Prescribed burn<strong>in</strong>g may be undertaken <strong>for</strong> ecological or other purposes, but more <strong>of</strong>ten it is <strong>for</strong> the<br />
purpose <strong>of</strong> fuel reduction and modification (Text Box 3.1). In <strong>for</strong>ests, where the practice has a long<br />
history (Gill and Moore 1997), the aims are stated <strong>in</strong> various ways, but Moore and Shields (1996) are<br />
more comprehensive than most. They state that the aims <strong>of</strong> fuel <strong>management</strong> – hazard reduction<br />
burn<strong>in</strong>g – are to:<br />
• Reduce the total weight <strong>of</strong> fuels to reduce the rate <strong>of</strong> spread and <strong>in</strong>tensity <strong>of</strong> a <strong>fire</strong><br />
• Reduce height <strong>of</strong> the fuel bed and there<strong>for</strong>e flame height<br />
• Remove <strong>fire</strong>-brand material, pr<strong>in</strong>cipally fibrous bark, and there<strong>for</strong>e the chance <strong>of</strong> spot <strong>fire</strong>s.<br />
As a result, <strong>fire</strong> suppression capability is <strong>in</strong>creased, the impact <strong>of</strong> <strong>fire</strong> on <strong>for</strong>est assets is reduced and<br />
the safety <strong>of</strong> <strong>fire</strong>fighters <strong>in</strong>creased (Moore and Shields 1996).<br />
An immediate effect <strong>of</strong> fuel reduction by burn<strong>in</strong>g <strong>in</strong> State Forests <strong>of</strong> New South Wales was to reduce<br />
f<strong>in</strong>e-fuel weight up to 70% over 30 to 60% <strong>of</strong> the gross area be<strong>in</strong>g treated (Moore and Shields 1996).<br />
For strategic corridors and fuel <strong>management</strong> over broad areas <strong>of</strong> <strong>for</strong>est, burn<strong>in</strong>g up to 60% <strong>of</strong> the<br />
area treated was desired (Moore and Shields 1966). In asset-protection zones <strong>in</strong> Victoria, the aim <strong>for</strong><br />
the percentage <strong>of</strong> area to be burnt is 90% (McDonald 1999). In strategic fuel-reduced corridor zones<br />
it is 80% and <strong>in</strong> the broad-area fuel reduced mosaic zone it is 50% (McDonald 1999). In Tasmanian<br />
Buttongrass (Gymnoschoenus sphaerocephalus) the figure is >70% (Marsden-Smedley 1993). Thus not<br />
all the fuel is burnt over a chosen area, even <strong>for</strong> asset-protection burn<strong>in</strong>g.<br />
Fire and adaptive <strong>management</strong> 47
![Metcalfe State Forest Fauna Species List [PDF File - 16.9 KB]](https://img.yumpu.com/22024301/1/184x260/metcalfe-state-forest-fauna-species-list-pdf-file-169-kb.jpg?quality=85)

![PPE Price List for Wildlife Volunteers [PDF File - 20.3 KB]](https://img.yumpu.com/15321634/1/190x135/ppe-price-list-for-wildlife-volunteers-pdf-file-203-kb.jpg?quality=85)