Integrating Southwest Power Pool Wind to Southeast Electricity ...
Integrating Southwest Power Pool Wind to Southeast Electricity ...
Integrating Southwest Power Pool Wind to Southeast Electricity ...

You also want an ePaper? Increase the reach of your titles
YUMPU automatically turns print PDFs into web optimized ePapers that Google loves.
site selection could have congregated the plants for each of regions in a smaller area, correlating<br />
the output <strong>to</strong> a higher degree and resulting in higher variability. This has direct consequences <strong>to</strong><br />
the results of the study since the lower the variability, the lower the balancing requirement for<br />
wind. This assumption of higher diversity tends <strong>to</strong> reduce the inter-BA cooperation benefits that<br />
are calculated later.<br />
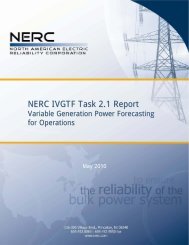
To illustrate, Figure 3-3 shows these diversity effects for an example set of plants from the actual<br />
data used in the study. Using the standard deviation of the 10 minute change in aggregate output<br />
as a metric, the variability of eight concentric aggregation areas is examined. The smallest is a<br />
single 100 WM plant moving in steps <strong>to</strong> the largest of a 12000 MW regional aggregation. Note<br />
that variability drops from more than 4.5% for the single plant <strong>to</strong> about 1% for the largest<br />
aggregation area.<br />
This aggregation has a direct effect on reserve requirements and ramping duty seen by the entity<br />
who balances the wind. If the wind is rising in one portion of the aggregation area, as the size of<br />
the area increases, it is much more likely that it is decreasing in another portion <strong>to</strong> reduce the size<br />
of the net change.<br />
Normalized 10 minute Sigma<br />
5.0%<br />
4.5%<br />
4.0%<br />
3.5%<br />
3.0%<br />
2.5%<br />
2.0%<br />
1.5%<br />
1.0%<br />
0.5%<br />
0.0%<br />
Effect of Geographic Diversity and Aggregation on Variability<br />
Normalized <strong>to</strong> Aggregate <strong>Wind</strong><br />
0 2000 4000 6000 8000 10000 12000 14000<br />
Total Aggregated Nameplate (MW)<br />
Figure 3-3<br />
Effect of diversity and aggregation on variability<br />
<strong>Wind</strong> Characteristics<br />
With the wind plants selected and assigned <strong>to</strong> the four study regions, aggregate wind data can be<br />
calculated and characteristics computed. Table 3-2 shows these characteristics tabulated with the<br />
coincident <strong>to</strong>tal and non-coincident <strong>to</strong>tal for the entire footprint.<br />
3-4