Integrating Southwest Power Pool Wind to Southeast Electricity ...
Integrating Southwest Power Pool Wind to Southeast Electricity ...
Integrating Southwest Power Pool Wind to Southeast Electricity ...

You also want an ePaper? Increase the reach of your titles
YUMPU automatically turns print PDFs into web optimized ePapers that Google loves.
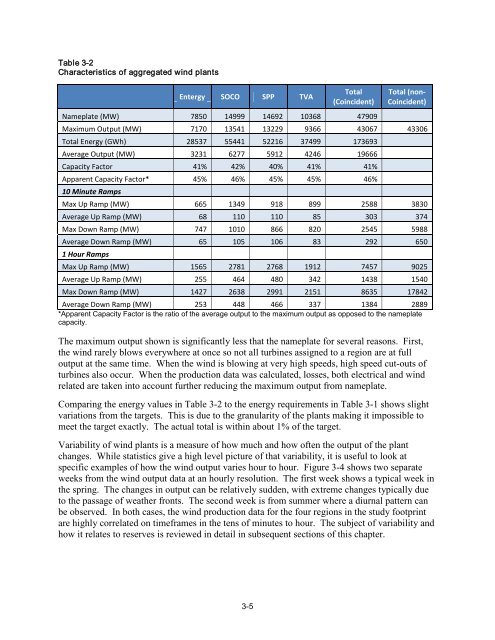
Table 3-2<br />
Characteristics of aggregated wind plants<br />
Entergy SOCO SPP TVA<br />
3-5<br />
Total<br />
(Coincident)<br />
Nameplate (MW) 7850 14999 14692 10368 47909<br />
Total (non-<br />
Coincident)<br />
Maximum Output (MW) 7170 13541 13229 9366 43067 43306<br />
Total Energy (GWh) 28537 55441 52216 37499 173693<br />
Average Output (MW) 3231 6277 5912 4246 19666<br />
Capacity Fac<strong>to</strong>r 41% 42% 40% 41% 41%<br />
Apparent Capacity Fac<strong>to</strong>r* 45% 46% 45% 45% 46%<br />
10 Minute Ramps<br />
Max Up Ramp (MW) 665 1349 918 899 2588 3830<br />
Average Up Ramp (MW) 68 110 110 85 303 374<br />
Max Down Ramp (MW) 747 1010 866 820 2545 5988<br />
Average Down Ramp (MW) 65 105 106 83 292 650<br />
1 Hour Ramps<br />
Max Up Ramp (MW) 1565 2781 2768 1912 7457 9025<br />
Average Up Ramp (MW) 255 464 480 342 1438 1540<br />
Max Down Ramp (MW) 1427 2638 2991 2151 8635 17842<br />
Average Down Ramp (MW) 253 448 466 337 1384 2889<br />
*Apparent Capacity Fac<strong>to</strong>r is the ratio of the average output <strong>to</strong> the maximum output as opposed <strong>to</strong> the nameplate<br />
capacity.<br />
The maximum output shown is significantly less that the nameplate for several reasons. First,<br />
the wind rarely blows everywhere at once so not all turbines assigned <strong>to</strong> a region are at full<br />
output at the same time. When the wind is blowing at very high speeds, high speed cut-outs of<br />
turbines also occur. When the production data was calculated, losses, both electrical and wind<br />
related are taken in<strong>to</strong> account further reducing the maximum output from nameplate.<br />
Comparing the energy values in Table 3-2 <strong>to</strong> the energy requirements in Table 3-1 shows slight<br />
variations from the targets. This is due <strong>to</strong> the granularity of the plants making it impossible <strong>to</strong><br />
meet the target exactly. The actual <strong>to</strong>tal is within about 1% of the target.<br />
Variability of wind plants is a measure of how much and how often the output of the plant<br />
changes. While statistics give a high level picture of that variability, it is useful <strong>to</strong> look at<br />
specific examples of how the wind output varies hour <strong>to</strong> hour. Figure 3-4 shows two separate<br />
weeks from the wind output data at an hourly resolution. The first week shows a typical week in<br />
the spring. The changes in output can be relatively sudden, with extreme changes typically due<br />
<strong>to</strong> the passage of weather fronts. The second week is from summer where a diurnal pattern can<br />
be observed. In both cases, the wind production data for the four regions in the study footprint<br />
are highly correlated on timeframes in the tens of minutes <strong>to</strong> hour. The subject of variability and<br />
how it relates <strong>to</strong> reserves is reviewed in detail in subsequent sections of this chapter.