Integrating Southwest Power Pool Wind to Southeast Electricity ...
Integrating Southwest Power Pool Wind to Southeast Electricity ...
Integrating Southwest Power Pool Wind to Southeast Electricity ...

You also want an ePaper? Increase the reach of your titles
YUMPU automatically turns print PDFs into web optimized ePapers that Google loves.
Hydro 4.8 4.8 4.8 4.8 4.8<br />
Nuclear 33.1 33.1 33.1 33.1 33.1<br />
Coal 76.4 76.0 78.5 78.6 77.8<br />
GasOil 0.8 0.8 0.7 0.7 0.7<br />
<strong>Wind</strong> 20.3 20.3 20.3 20.3 20.3<br />
Other 2.6 2.6 2.7 2.6 2.7<br />
Total Gen 154.8 154.8 154.8 154.8 154.8<br />
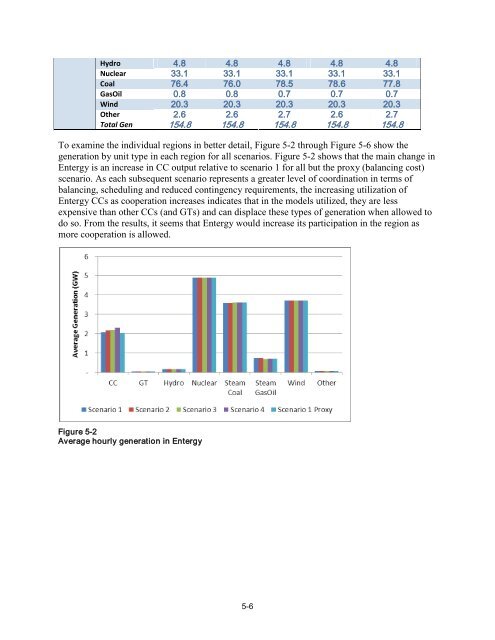
To examine the individual regions in better detail, Figure 5-2 through Figure 5-6 show the<br />
generation by unit type in each region for all scenarios. Figure 5-2 shows that the main change in<br />
Entergy is an increase in CC output relative <strong>to</strong> scenario 1 for all but the proxy (balancing cost)<br />
scenario. As each subsequent scenario represents a greater level of coordination in terms of<br />
balancing, scheduling and reduced contingency requirements, the increasing utilization of<br />
Entergy CCs as cooperation increases indicates that in the models utilized, they are less<br />
expensive than other CCs (and GTs) and can displace these types of generation when allowed <strong>to</strong><br />
do so. From the results, it seems that Entergy would increase its participation in the region as<br />
more cooperation is allowed.<br />
Figure 5-2<br />
Average hourly generation in Entergy<br />
5-6