Integrating Southwest Power Pool Wind to Southeast Electricity ...
Integrating Southwest Power Pool Wind to Southeast Electricity ...
Integrating Southwest Power Pool Wind to Southeast Electricity ...

Create successful ePaper yourself
Turn your PDF publications into a flip-book with our unique Google optimized e-Paper software.
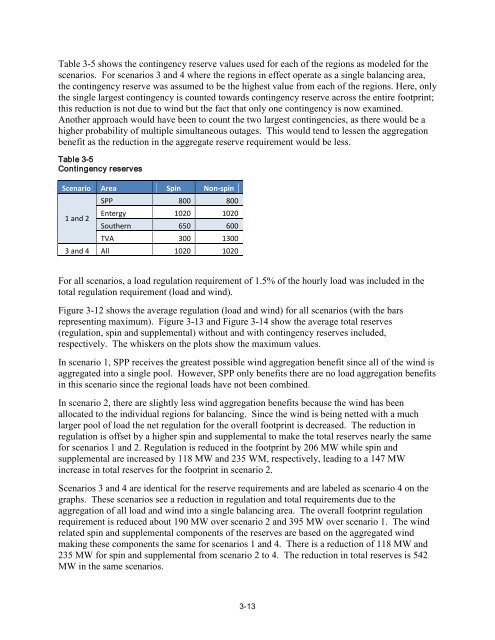
Table 3-5 shows the contingency reserve values used for each of the regions as modeled for the<br />
scenarios. For scenarios 3 and 4 where the regions in effect operate as a single balancing area,<br />
the contingency reserve was assumed <strong>to</strong> be the highest value from each of the regions. Here, only<br />
the single largest contingency is counted <strong>to</strong>wards contingency reserve across the entire footprint;<br />
this reduction is not due <strong>to</strong> wind but the fact that only one contingency is now examined.<br />
Another approach would have been <strong>to</strong> count the two largest contingencies, as there would be a<br />
higher probability of multiple simultaneous outages. This would tend <strong>to</strong> lessen the aggregation<br />
benefit as the reduction in the aggregate reserve requirement would be less.<br />
Table 3-5<br />
Contingency reserves<br />
Scenario Area Spin Non-spin<br />
SPP 800 800<br />
1 and 2<br />
Entergy<br />
Southern<br />
1020<br />
650<br />
1020<br />
600<br />
TVA 300 1300<br />
3 and 4 All 1020 1020<br />
For all scenarios, a load regulation requirement of 1.5% of the hourly load was included in the<br />
<strong>to</strong>tal regulation requirement (load and wind).<br />
Figure 3-12 shows the average regulation (load and wind) for all scenarios (with the bars<br />
representing maximum). Figure 3-13 and Figure 3-14 show the average <strong>to</strong>tal reserves<br />
(regulation, spin and supplemental) without and with contingency reserves included,<br />
respectively. The whiskers on the plots show the maximum values.<br />
In scenario 1, SPP receives the greatest possible wind aggregation benefit since all of the wind is<br />
aggregated in<strong>to</strong> a single pool. However, SPP only benefits there are no load aggregation benefits<br />
in this scenario since the regional loads have not been combined.<br />
In scenario 2, there are slightly less wind aggregation benefits because the wind has been<br />
allocated <strong>to</strong> the individual regions for balancing. Since the wind is being netted with a much<br />
larger pool of load the net regulation for the overall footprint is decreased. The reduction in<br />
regulation is offset by a higher spin and supplemental <strong>to</strong> make the <strong>to</strong>tal reserves nearly the same<br />
for scenarios 1 and 2. Regulation is reduced in the footprint by 206 MW while spin and<br />
supplemental are increased by 118 MW and 235 WM, respectively, leading <strong>to</strong> a 147 MW<br />
increase in <strong>to</strong>tal reserves for the footprint in scenario 2.<br />
Scenarios 3 and 4 are identical for the reserve requirements and are labeled as scenario 4 on the<br />
graphs. These scenarios see a reduction in regulation and <strong>to</strong>tal requirements due <strong>to</strong> the<br />
aggregation of all load and wind in<strong>to</strong> a single balancing area. The overall footprint regulation<br />
requirement is reduced about 190 MW over scenario 2 and 395 MW over scenario 1. The wind<br />
related spin and supplemental components of the reserves are based on the aggregated wind<br />
making these components the same for scenarios 1 and 4. There is a reduction of 118 MW and<br />
235 MW for spin and supplemental from scenario 2 <strong>to</strong> 4. The reduction in <strong>to</strong>tal reserves is 542<br />
MW in the same scenarios.<br />
3-13