AC Choksi Share Brokers Private Limited - Myiris.com
AC Choksi Share Brokers Private Limited - Myiris.com
AC Choksi Share Brokers Private Limited - Myiris.com

Create successful ePaper yourself
Turn your PDF publications into a flip-book with our unique Google optimized e-Paper software.
A C <strong>Choksi</strong><br />
<strong>Share</strong> <strong>Brokers</strong> <strong>Private</strong> <strong>Limited</strong><br />
INITIATION REPORT | BAJAJ CORP LTD. Sept 09, 2011<br />
DCF-Valuation<br />
Valuation:<br />
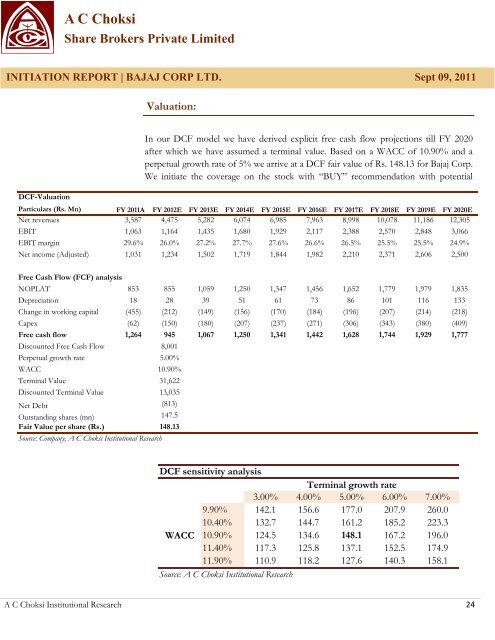
In our DCF model we have derived explicit free cash flow projections till FY 2020<br />
after which we have assumed a terminal value. Based on a W<strong>AC</strong>C of 10.90% and a<br />
perpetual growth rate of 5% we arrive at a DCF fair value of Rs. 148.13 for Bajaj Corp.<br />
We initiate the coverage on the stock with “BUY” re<strong>com</strong>mendation with potential<br />
upside of 19.8%.<br />
Particulars (Rs. Mn) FY 2011A FY 2012E FY 2013E FY 2014E FY 2015E FY 2016E FY 2017E FY 2018E FY 2019E FY 2020E<br />
Net revenues 3,587 4,475 5,282 6,074 6,985 7,963 8,998 10,078 11,186 12,305<br />
EBIT 1,063 1,164 1,435 1,680 1,929 2,117 2,388 2,570 2,848 3,066<br />
EBIT margin 29.6% 26.0% 27.2% 27.7% 27.6% 26.6% 26.5% 25.5% 25.5% 24.9%<br />
Net in<strong>com</strong>e (Adjusted) 1,031 1,234 1,502 1,719 1,844 1,982 2,210 2,371 2,606 2,500<br />
Free Cash Flow (FCF) analysis<br />
NOPLAT 853 855 1,059 1,250 1,347 1,456 1,652 1,779 1,979 1,835<br />
Depreciation 18 28 39 51 61 73 86 101 116 133<br />
Change in working capital (455) (212) (149) (156) (170) (184) (196) (207) (214) (218)<br />
Capex (62) (150) (180) (207) (237) (271) (306) (343) (380) (409)<br />
Free cash flow 1,264 945 1,067 1,250 1,341 1,442 1,628 1,744 1,929 1,777<br />
Discounted Free Cash Flow 8,001<br />
Perpetual growth rate 5.00%<br />
W<strong>AC</strong>C 10.90%<br />
Terminal Value 31,622<br />
Discounted Terminal Value 13,035<br />
Net Debt<br />
(813)<br />
Outstanding shares (mn)<br />
147.5<br />
Fair Value per share (Rs.) 148.13<br />
Source: Company, A C <strong>Choksi</strong> Institutional Research<br />
DCF sensitivity analysis<br />
Terminal growth rate<br />
148.13 3.00% 4.00% 5.00% 6.00% 7.00%<br />
9.90% 142.1 156.6 177.0 207.9 260.0<br />
10.40% 132.7 144.7 161.2 185.2 223.3<br />
W<strong>AC</strong>C 10.90% 124.5 134.6 148.1 167.2 196.0<br />
11.40% 117.3 125.8 137.1 152.5 174.9<br />
11.90% 110.9 118.2 127.6 140.3 158.1<br />
Source: A C <strong>Choksi</strong> Institutional Research<br />
A C <strong>Choksi</strong> Institutional Research 24