Tropical Cyclone Report - National Hurricane Center - NOAA
Tropical Cyclone Report - National Hurricane Center - NOAA
Tropical Cyclone Report - National Hurricane Center - NOAA

Create successful ePaper yourself
Turn your PDF publications into a flip-book with our unique Google optimized e-Paper software.
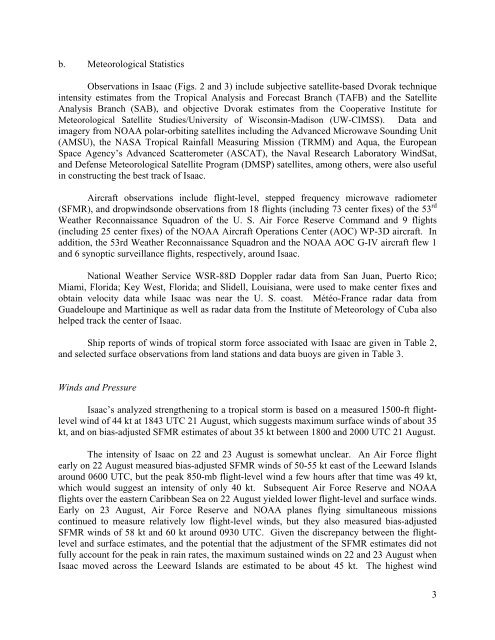
. Meteorological Statistics<br />
Observations in Isaac (Figs. 2 and 3) include subjective satellite-based Dvorak technique<br />
intensity estimates from the <strong>Tropical</strong> Analysis and Forecast Branch (TAFB) and the Satellite<br />
Analysis Branch (SAB), and objective Dvorak estimates from the Cooperative Institute for<br />
Meteorological Satellite Studies/University of Wisconsin-Madison (UW-CIMSS). Data and<br />
imagery from <strong>NOAA</strong> polar-orbiting satellites including the Advanced Microwave Sounding Unit<br />
(AMSU), the NASA <strong>Tropical</strong> Rainfall Measuring Mission (TRMM) and Aqua, the European<br />
Space Agency’s Advanced Scatterometer (ASCAT), the Naval Research Laboratory WindSat,<br />
and Defense Meteorological Satellite Program (DMSP) satellites, among others, were also useful<br />
in constructing the best track of Isaac.<br />
Aircraft observations include flight-level, stepped frequency microwave radiometer<br />
(SFMR), and dropwindsonde observations from 18 flights (including 73 center fixes) of the 53 rd<br />
Weather Reconnaissance Squadron of the U. S. Air Force Reserve Command and 9 flights<br />
(including 25 center fixes) of the <strong>NOAA</strong> Aircraft Operations <strong>Center</strong> (AOC) WP-3D aircraft. In<br />
addition, the 53rd Weather Reconnaissance Squadron and the <strong>NOAA</strong> AOC G-IV aircraft flew 1<br />
and 6 synoptic surveillance flights, respectively, around Isaac.<br />
<strong>National</strong> Weather Service WSR-88D Doppler radar data from San Juan, Puerto Rico;<br />
Miami, Florida; Key West, Florida; and Slidell, Louisiana, were used to make center fixes and<br />
obtain velocity data while Isaac was near the U. S. coast. Météo-France radar data from<br />
Guadeloupe and Martinique as well as radar data from the Institute of Meteorology of Cuba also<br />
helped track the center of Isaac.<br />
Ship reports of winds of tropical storm force associated with Isaac are given in Table 2,<br />
and selected surface observations from land stations and data buoys are given in Table 3.<br />
Winds and Pressure<br />
Isaac’s analyzed strengthening to a tropical storm is based on a measured 1500-ft flightlevel<br />
wind of 44 kt at 1843 UTC 21 August, which suggests maximum surface winds of about 35<br />
kt, and on bias-adjusted SFMR estimates of about 35 kt between 1800 and 2000 UTC 21 August.<br />
The intensity of Isaac on 22 and 23 August is somewhat unclear. An Air Force flight<br />
early on 22 August measured bias-adjusted SFMR winds of 50-55 kt east of the Leeward Islands<br />
around 0600 UTC, but the peak 850-mb flight-level wind a few hours after that time was 49 kt,<br />
which would suggest an intensity of only 40 kt. Subsequent Air Force Reserve and <strong>NOAA</strong><br />
flights over the eastern Caribbean Sea on 22 August yielded lower flight-level and surface winds.<br />
Early on 23 August, Air Force Reserve and <strong>NOAA</strong> planes flying simultaneous missions<br />
continued to measure relatively low flight-level winds, but they also measured bias-adjusted<br />
SFMR winds of 58 kt and 60 kt around 0930 UTC. Given the discrepancy between the flightlevel<br />
and surface estimates, and the potential that the adjustment of the SFMR estimates did not<br />
fully account for the peak in rain rates, the maximum sustained winds on 22 and 23 August when<br />
Isaac moved across the Leeward Islands are estimated to be about 45 kt. The highest wind<br />
3