Tropical Cyclone Report - National Hurricane Center - NOAA
Tropical Cyclone Report - National Hurricane Center - NOAA
Tropical Cyclone Report - National Hurricane Center - NOAA

Create successful ePaper yourself
Turn your PDF publications into a flip-book with our unique Google optimized e-Paper software.
Pressure (mb)<br />
1010<br />
1000<br />
990<br />
980<br />
970<br />
BEST TRACK<br />
KZC P-W<br />
Sat (TAFB)<br />
Sat (SAB)<br />
ADT<br />
AMSU<br />
AC (sfc)<br />
Surface<br />
Analysis<br />
960<br />
8/20 8/22 8/24 8/26 8/28 8/30 9/1<br />
Date (Month/Day)<br />
<strong>Hurricane</strong> Isaac<br />
21 August - 1 September 2012<br />
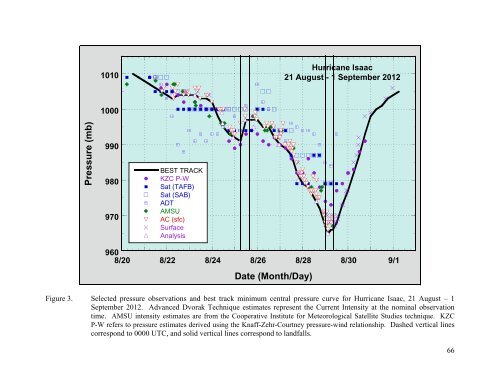
Figure 3. Selected pressure observations and best track minimum central pressure curve for <strong>Hurricane</strong> Isaac, 21 August – 1<br />
September 2012. Advanced Dvorak Technique estimates represent the Current Intensity at the nominal observation<br />
time. AMSU intensity estimates are from the Cooperative Institute for Meteorological Satellite Studies technique. KZC<br />
P-W refers to pressure estimates derived using the Knaff-Zehr-Courtney pressure-wind relationship. Dashed vertical lines<br />
correspond to 0000 UTC, and solid vertical lines correspond to landfalls.<br />
66