Tropical Cyclone Report - National Hurricane Center - NOAA
Tropical Cyclone Report - National Hurricane Center - NOAA
Tropical Cyclone Report - National Hurricane Center - NOAA

You also want an ePaper? Increase the reach of your titles
YUMPU automatically turns print PDFs into web optimized ePapers that Google loves.
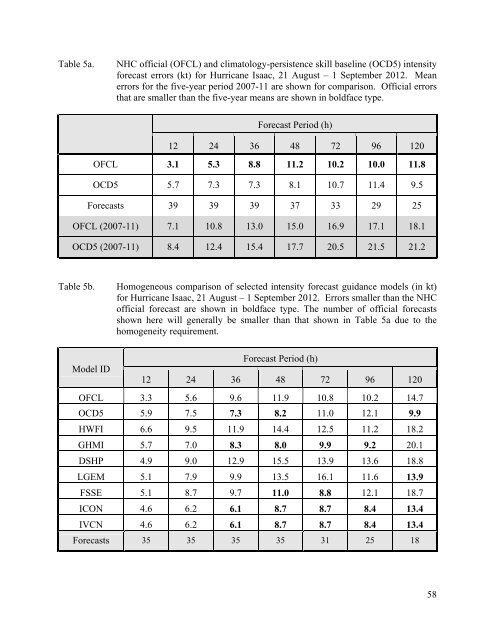
Table 5a. NHC official (OFCL) and climatology-persistence skill baseline (OCD5) intensity<br />
forecast errors (kt) for <strong>Hurricane</strong> Isaac, 21 August – 1 September 2012. Mean<br />
errors for the five-year period 2007-11 are shown for comparison. Official errors<br />
that are smaller than the five-year means are shown in boldface type.<br />
Forecast Period (h)<br />
12 24 36 48 72 96 120<br />
OFCL 3.1 5.3 8.8 11.2 10.2 10.0 11.8<br />
OCD5 5.7 7.3 7.3 8.1 10.7 11.4 9.5<br />
Forecasts 39 39 39 37 33 29 25<br />
OFCL (2007-11) 7.1 10.8 13.0 15.0 16.9 17.1 18.1<br />
OCD5 (2007-11) 8.4 12.4 15.4 17.7 20.5 21.5 21.2<br />
Table 5b. Homogeneous comparison of selected intensity forecast guidance models (in kt)<br />
for <strong>Hurricane</strong> Isaac, 21 August – 1 September 2012. Errors smaller than the NHC<br />
official forecast are shown in boldface type. The number of official forecasts<br />
shown here will generally be smaller than that shown in Table 5a due to the<br />
homogeneity requirement.<br />
Model ID<br />
Forecast Period (h)<br />
12 24 36 48 72 96 120<br />
OFCL 3.3 5.6 9.6 11.9 10.8 10.2 14.7<br />
OCD5 5.9 7.5 7.3 8.2 11.0 12.1 9.9<br />
HWFI 6.6 9.5 11.9 14.4 12.5 11.2 18.2<br />
GHMI 5.7 7.0 8.3 8.0 9.9 9.2 20.1<br />
DSHP 4.9 9.0 12.9 15.5 13.9 13.6 18.8<br />
LGEM 5.1 7.9 9.9 13.5 16.1 11.6 13.9<br />
FSSE 5.1 8.7 9.7 11.0 8.8 12.1 18.7<br />
ICON 4.6 6.2 6.1 8.7 8.7 8.4 13.4<br />
IVCN 4.6 6.2 6.1 8.7 8.7 8.4 13.4<br />
Forecasts 35 35 35 35 31 25 18<br />
58